Real Estate Stats December 7, 2023

Kawartha Lakes Housing November 2023

Kawartha Lakes Housing November 2023

Kawartha Lakes

Housing Market Report for November 2023

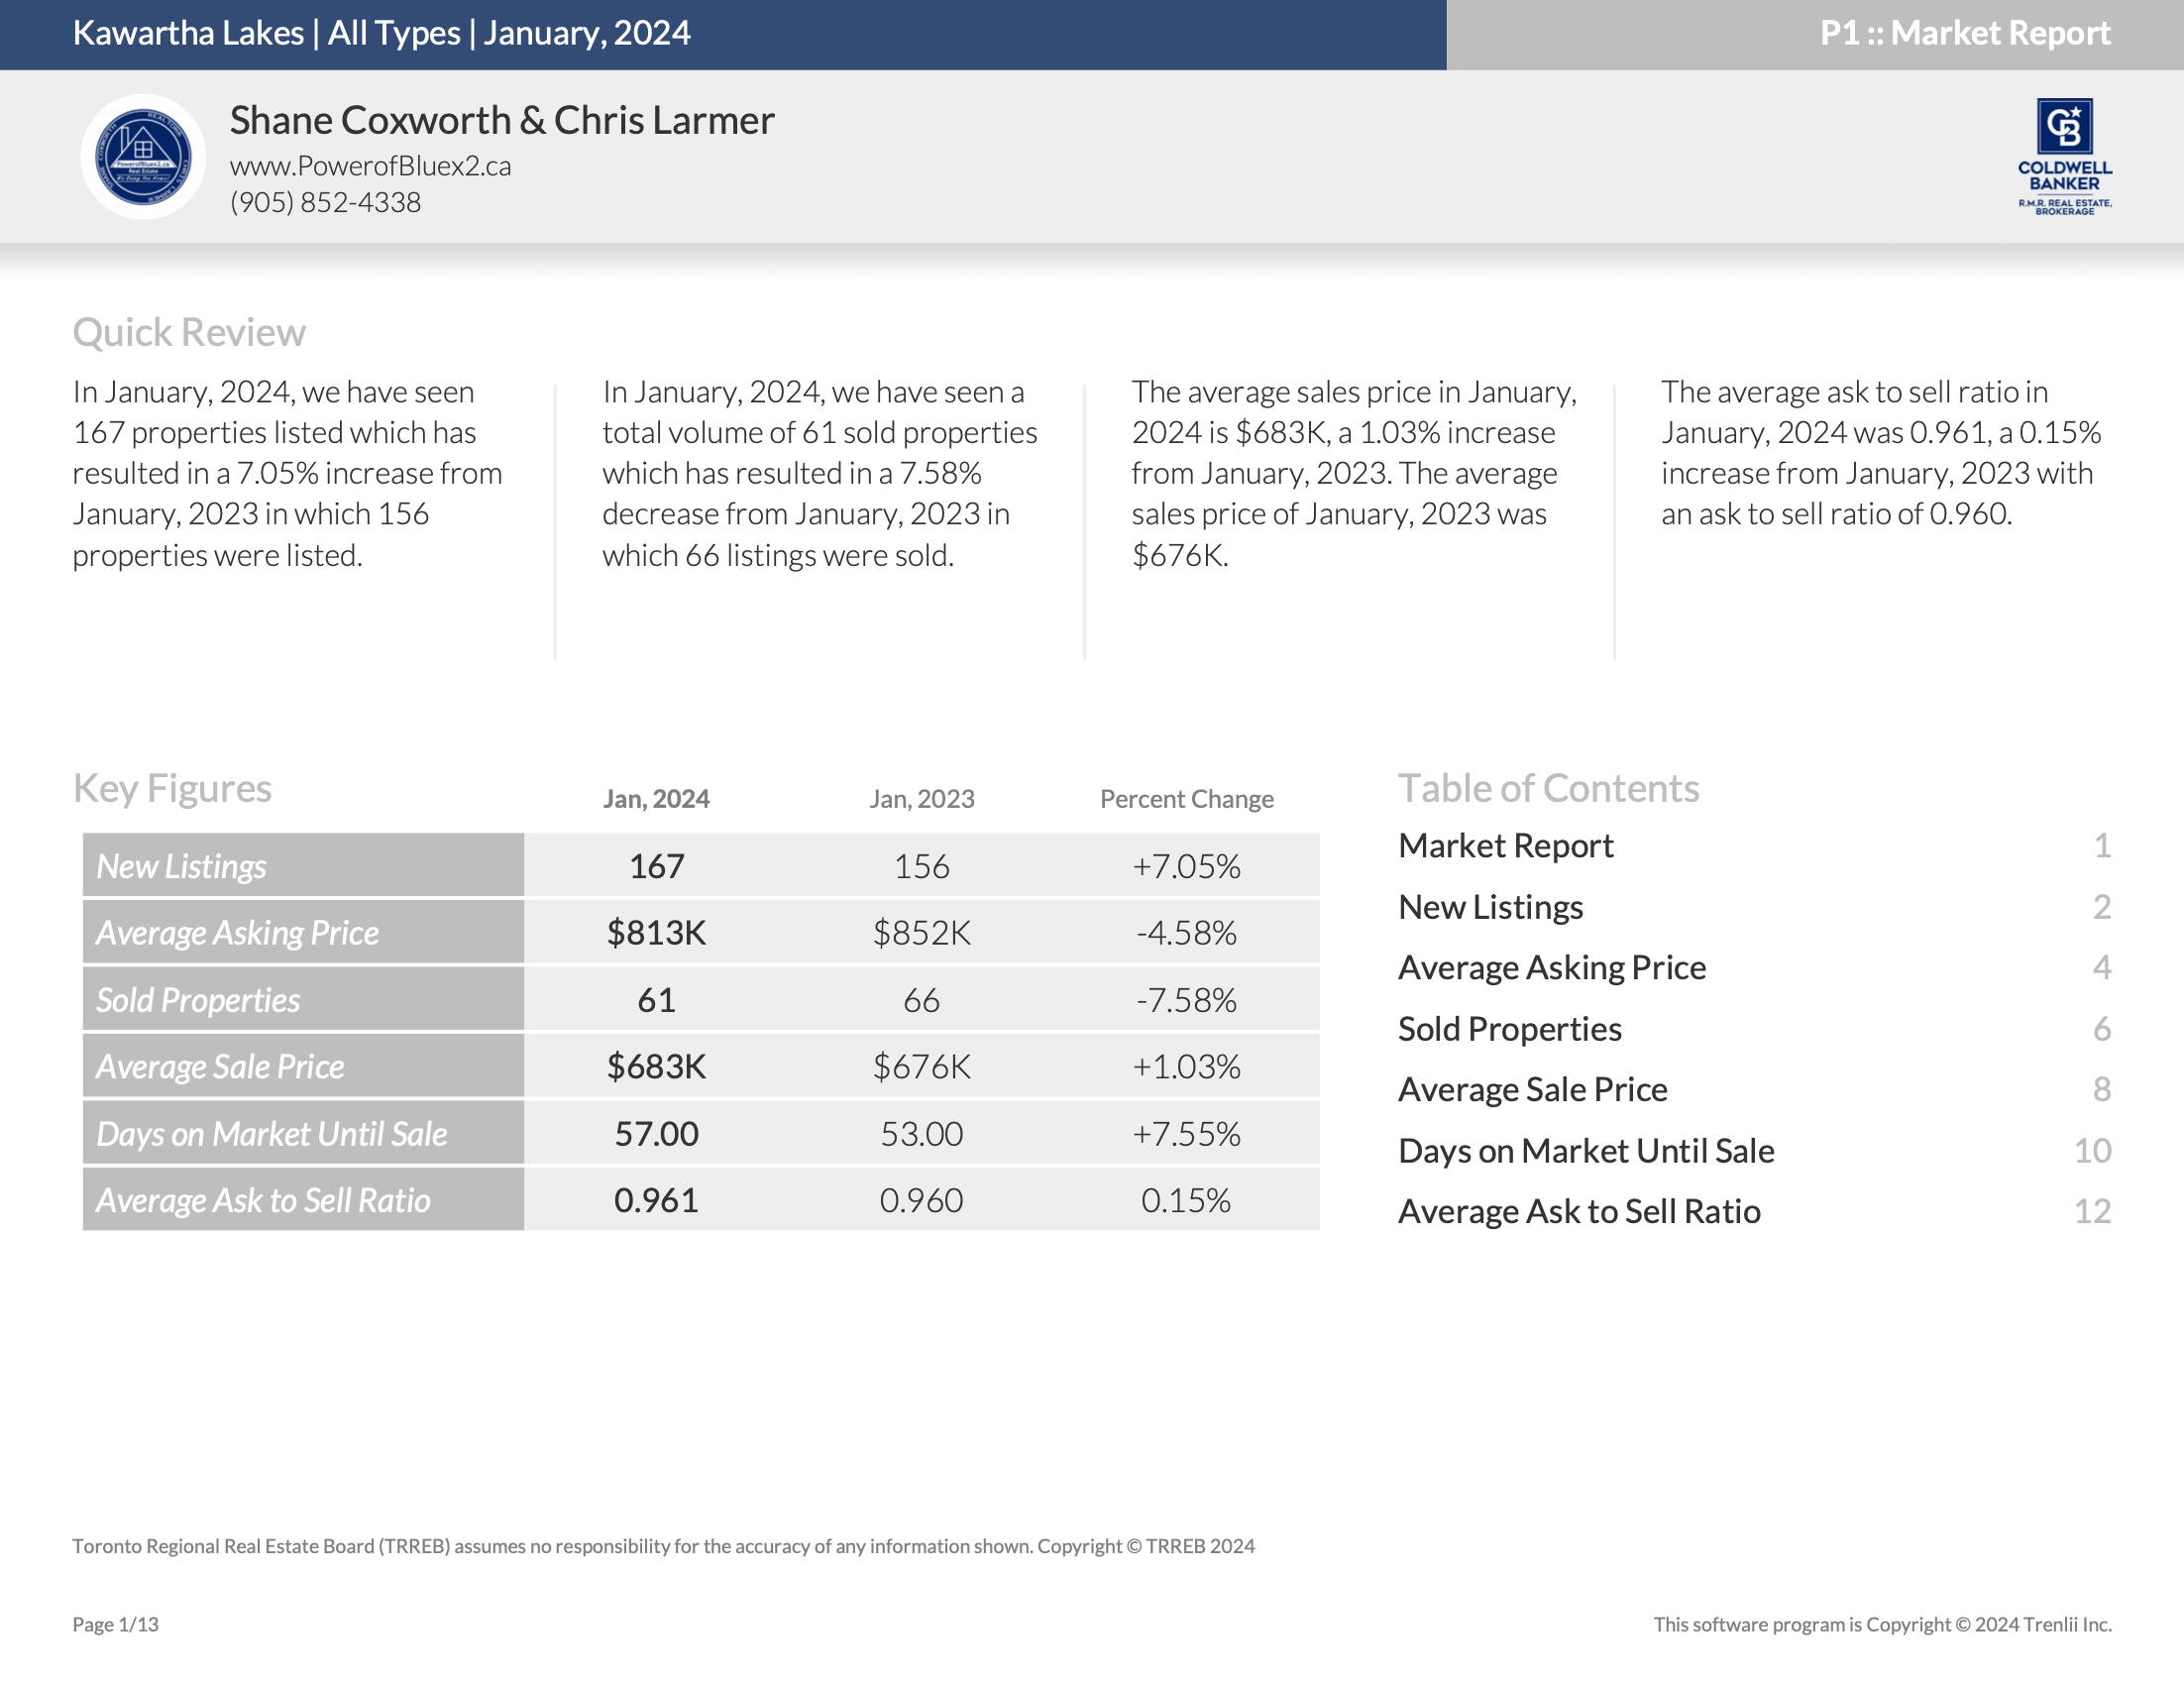
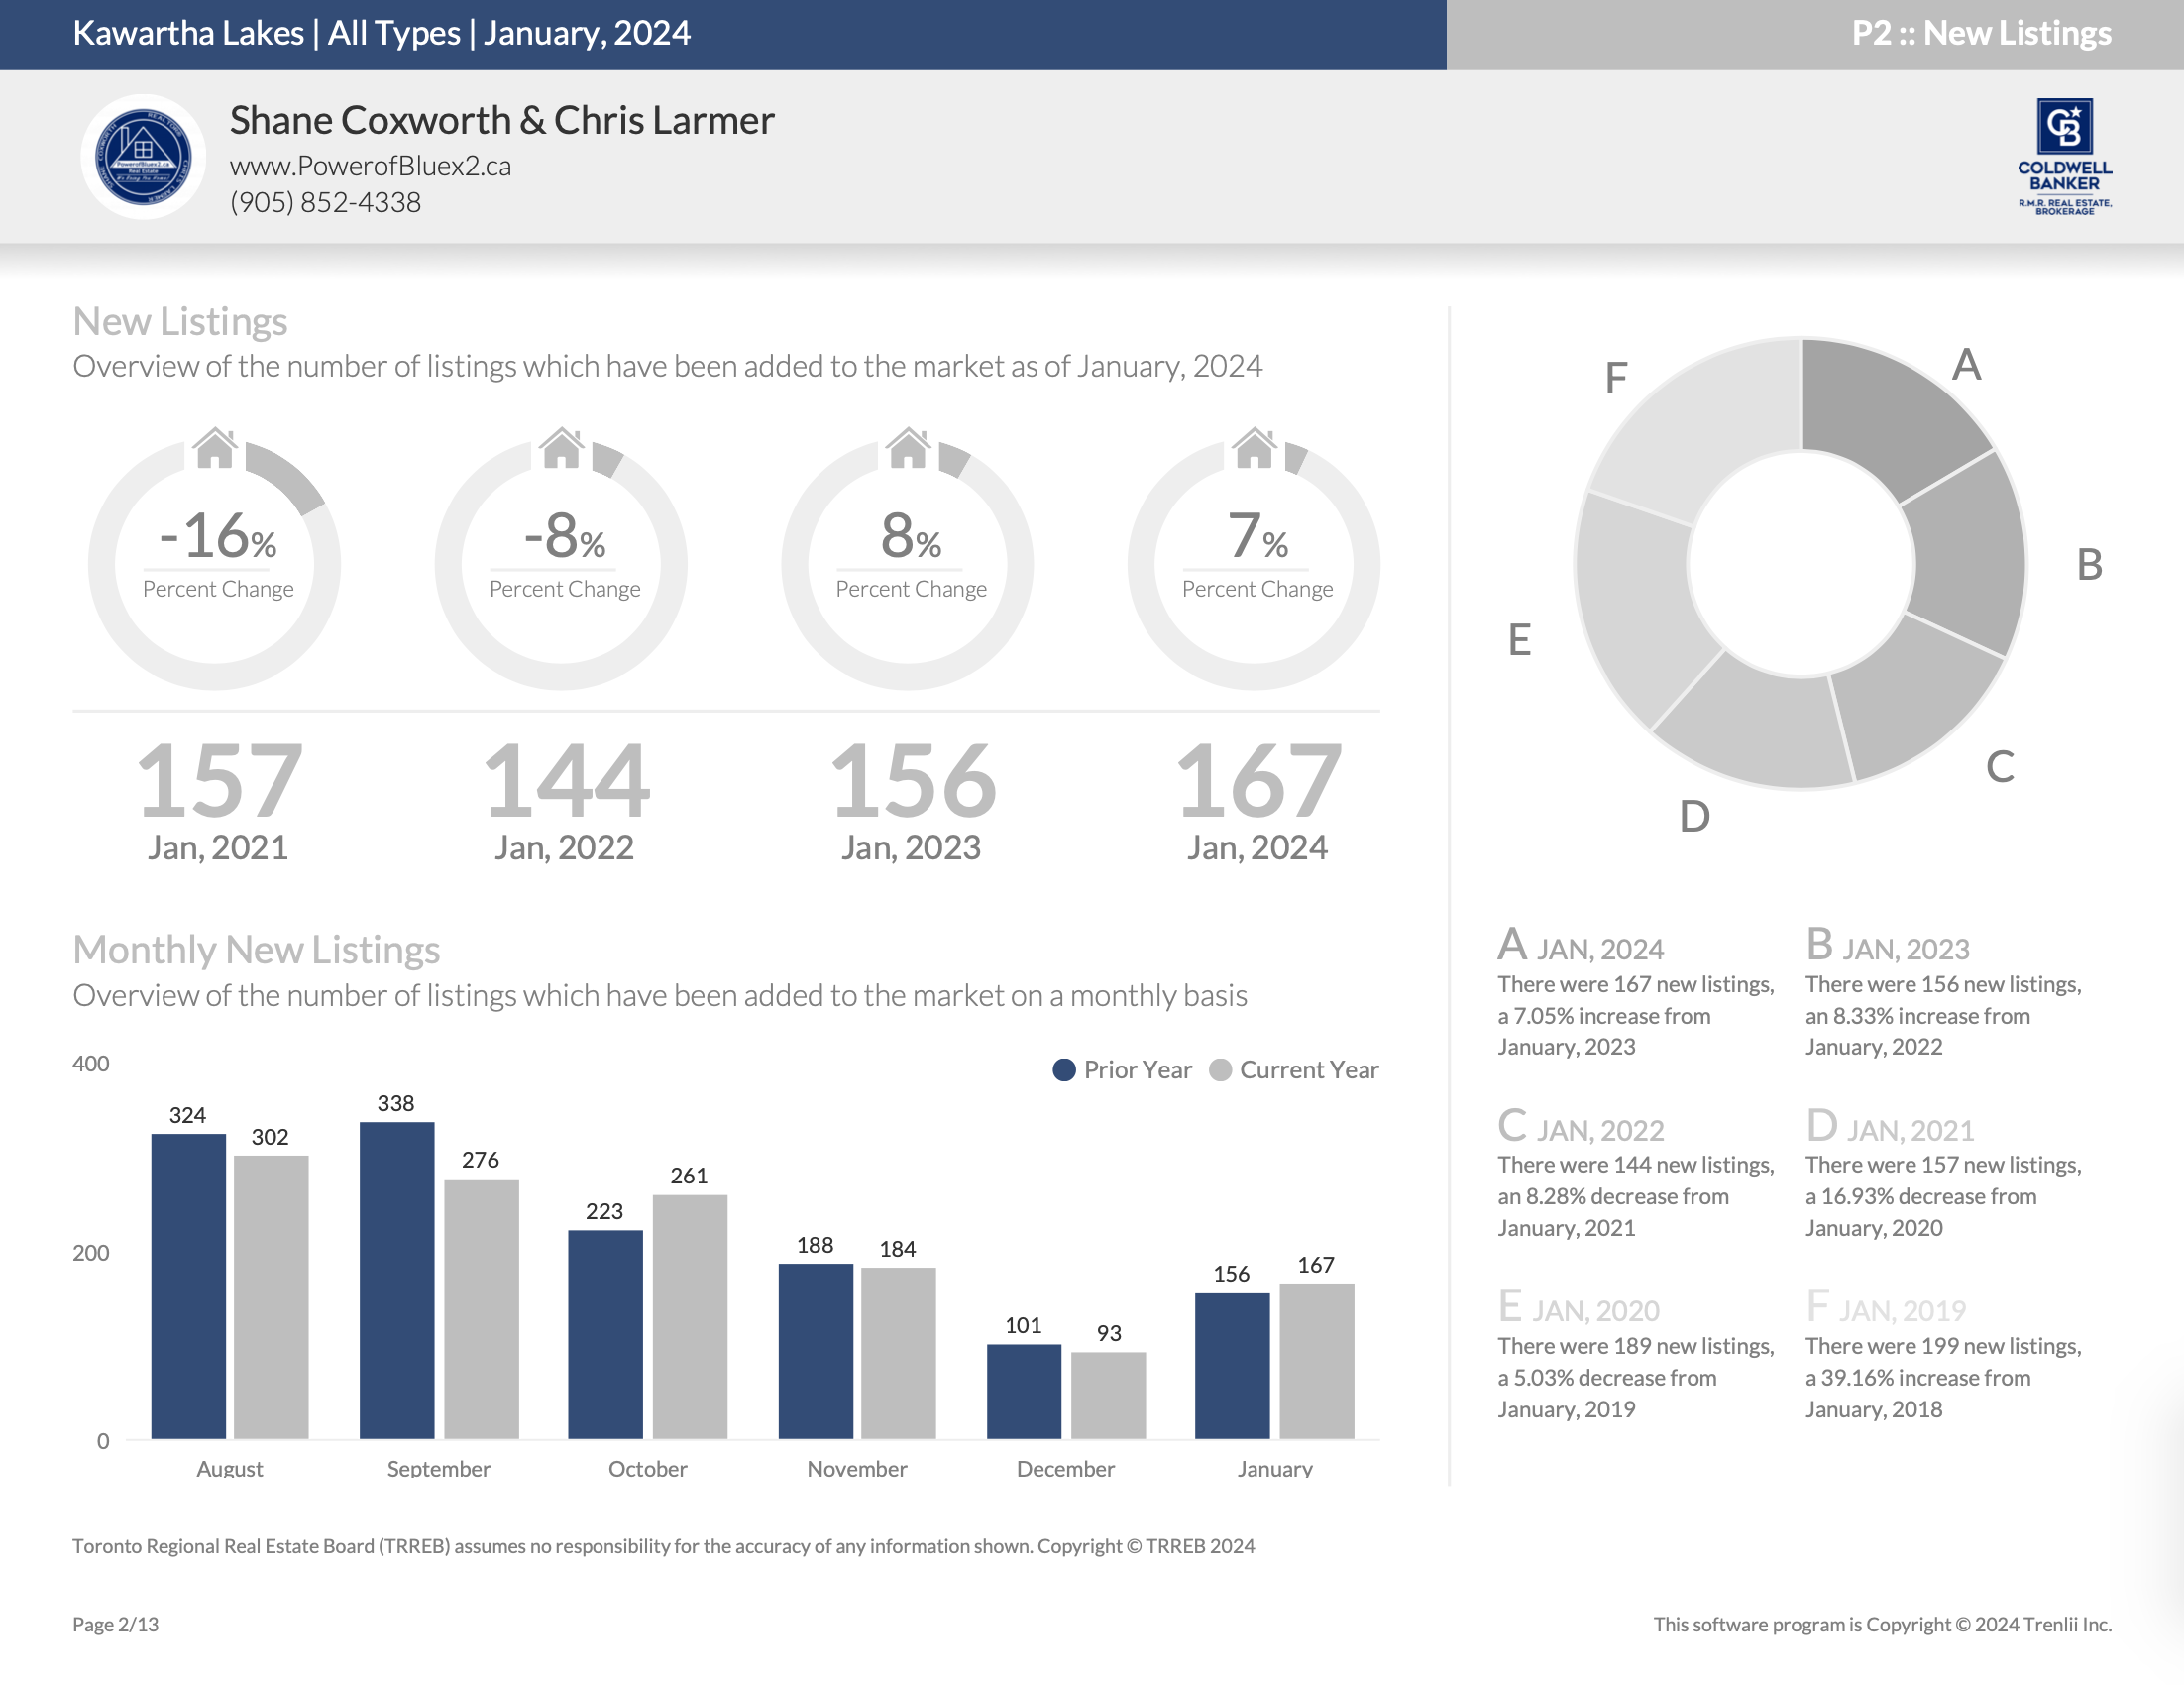
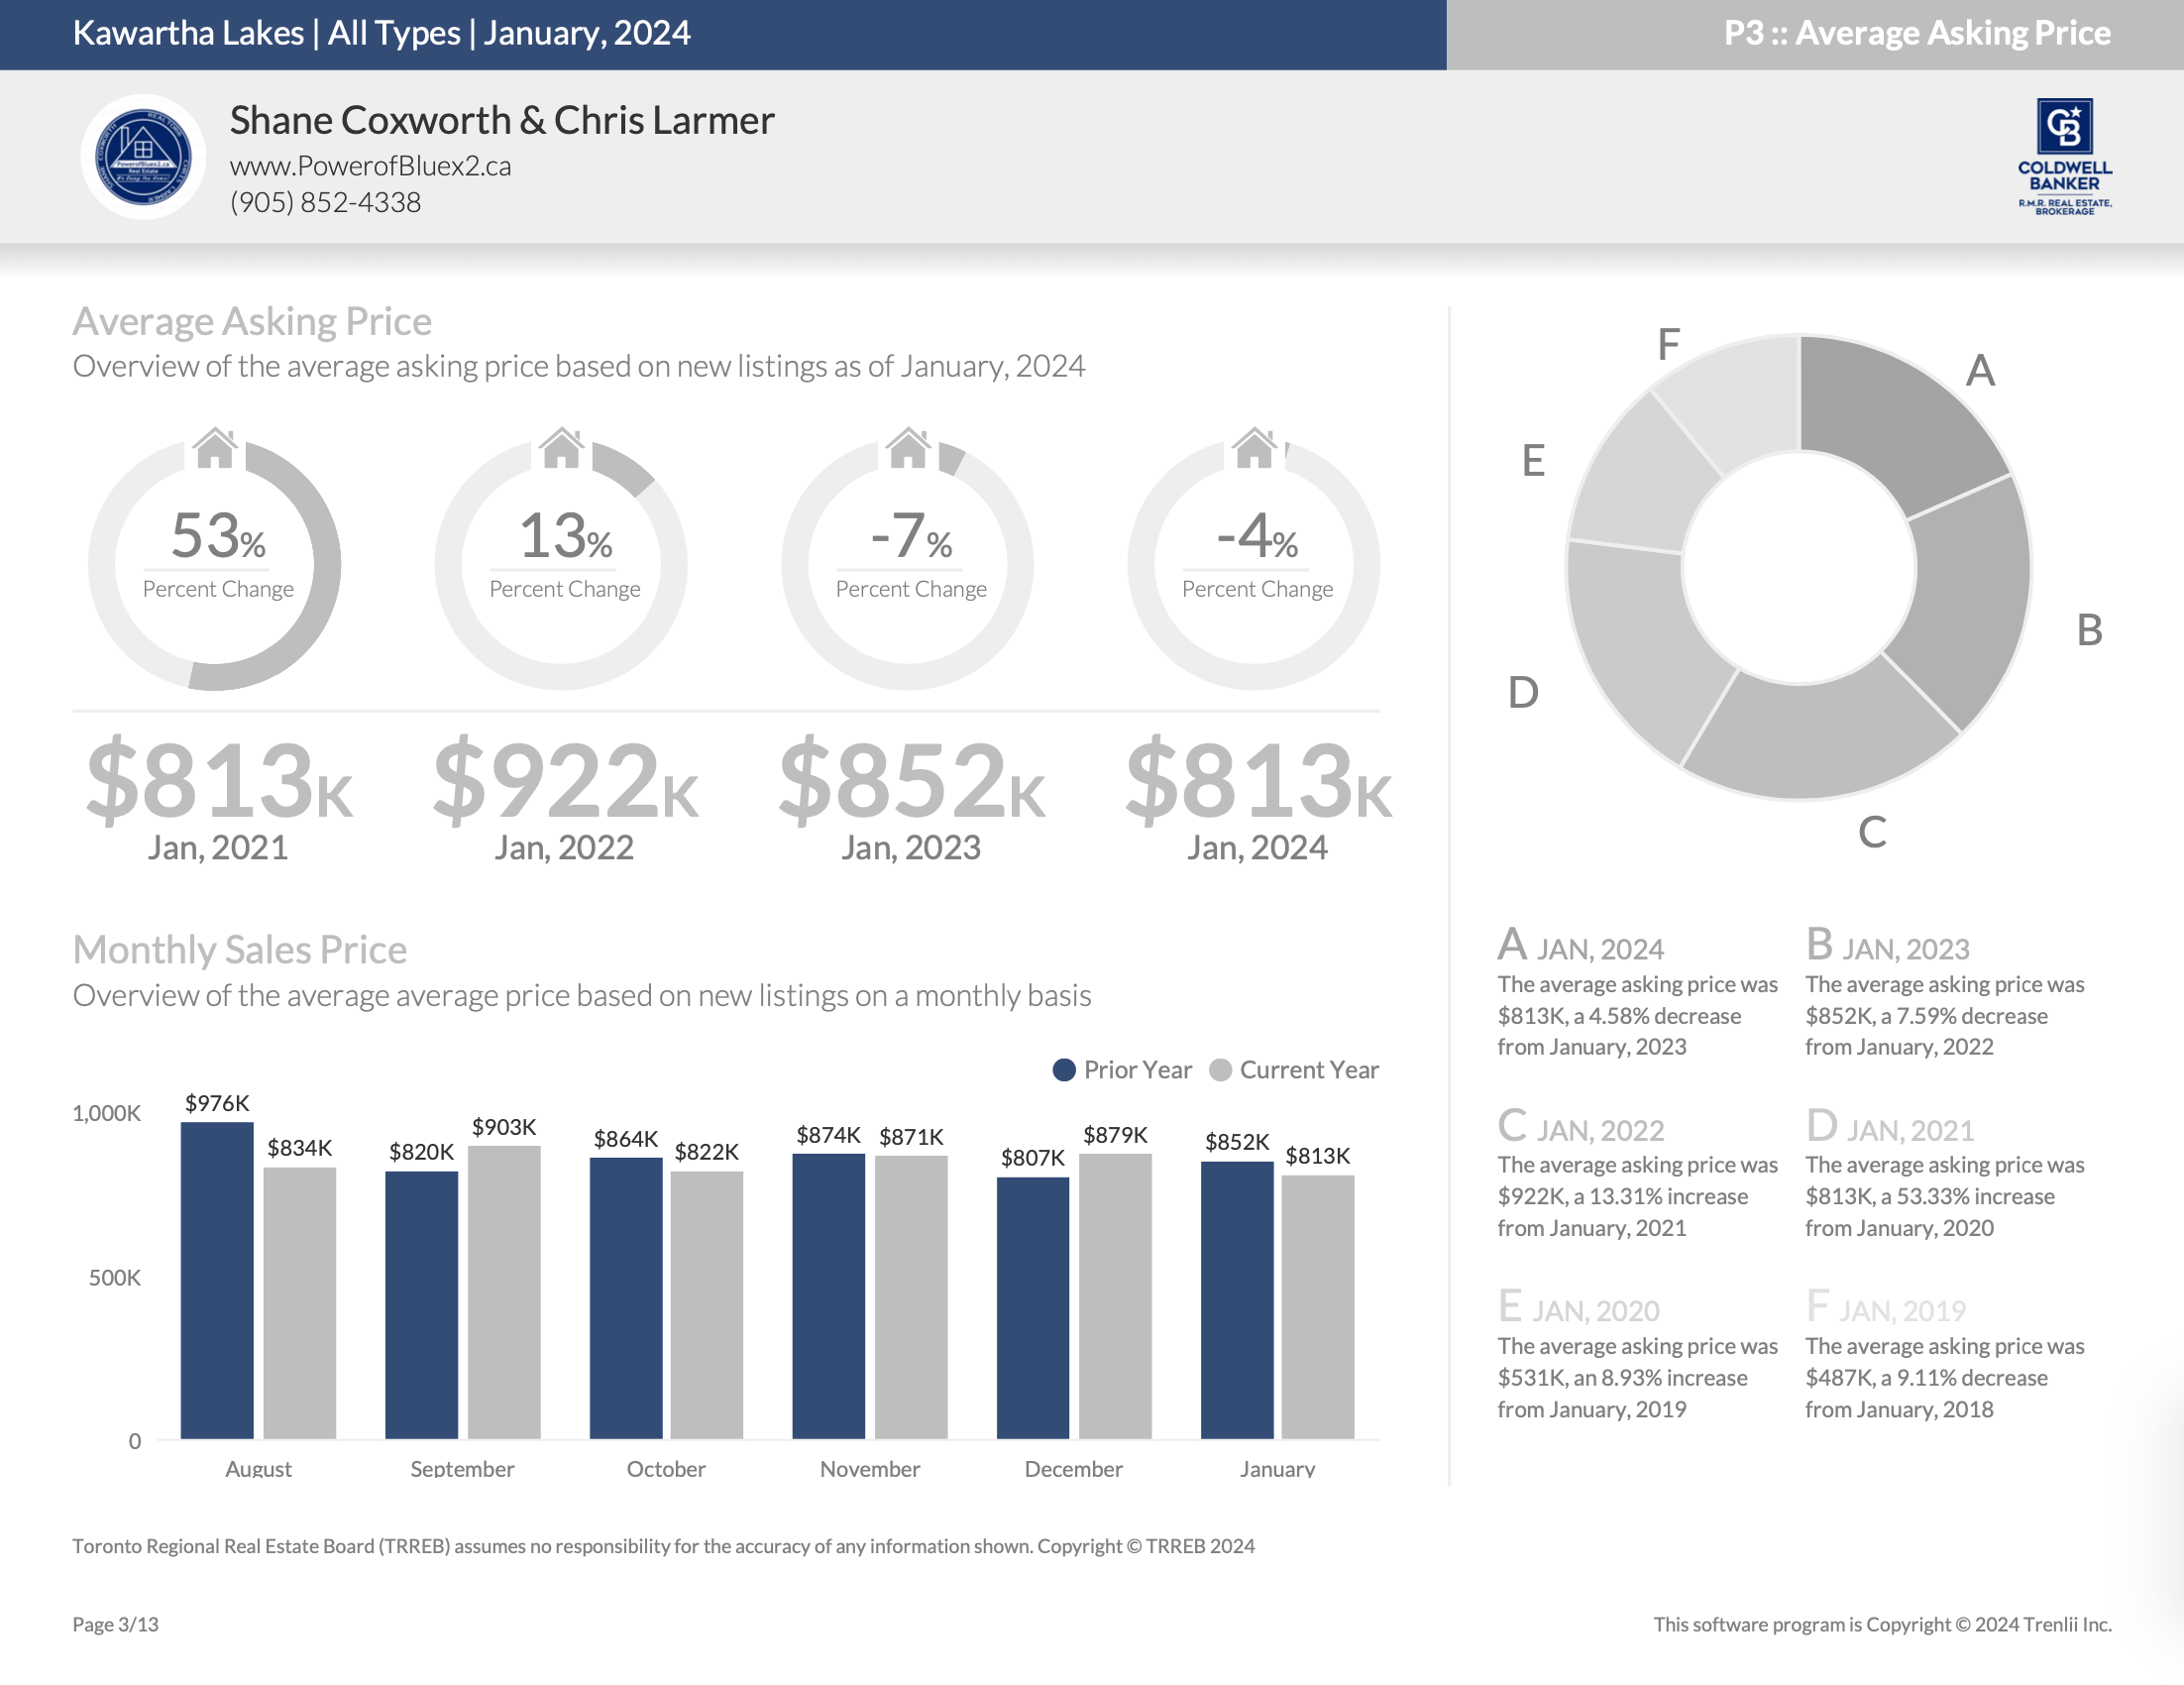
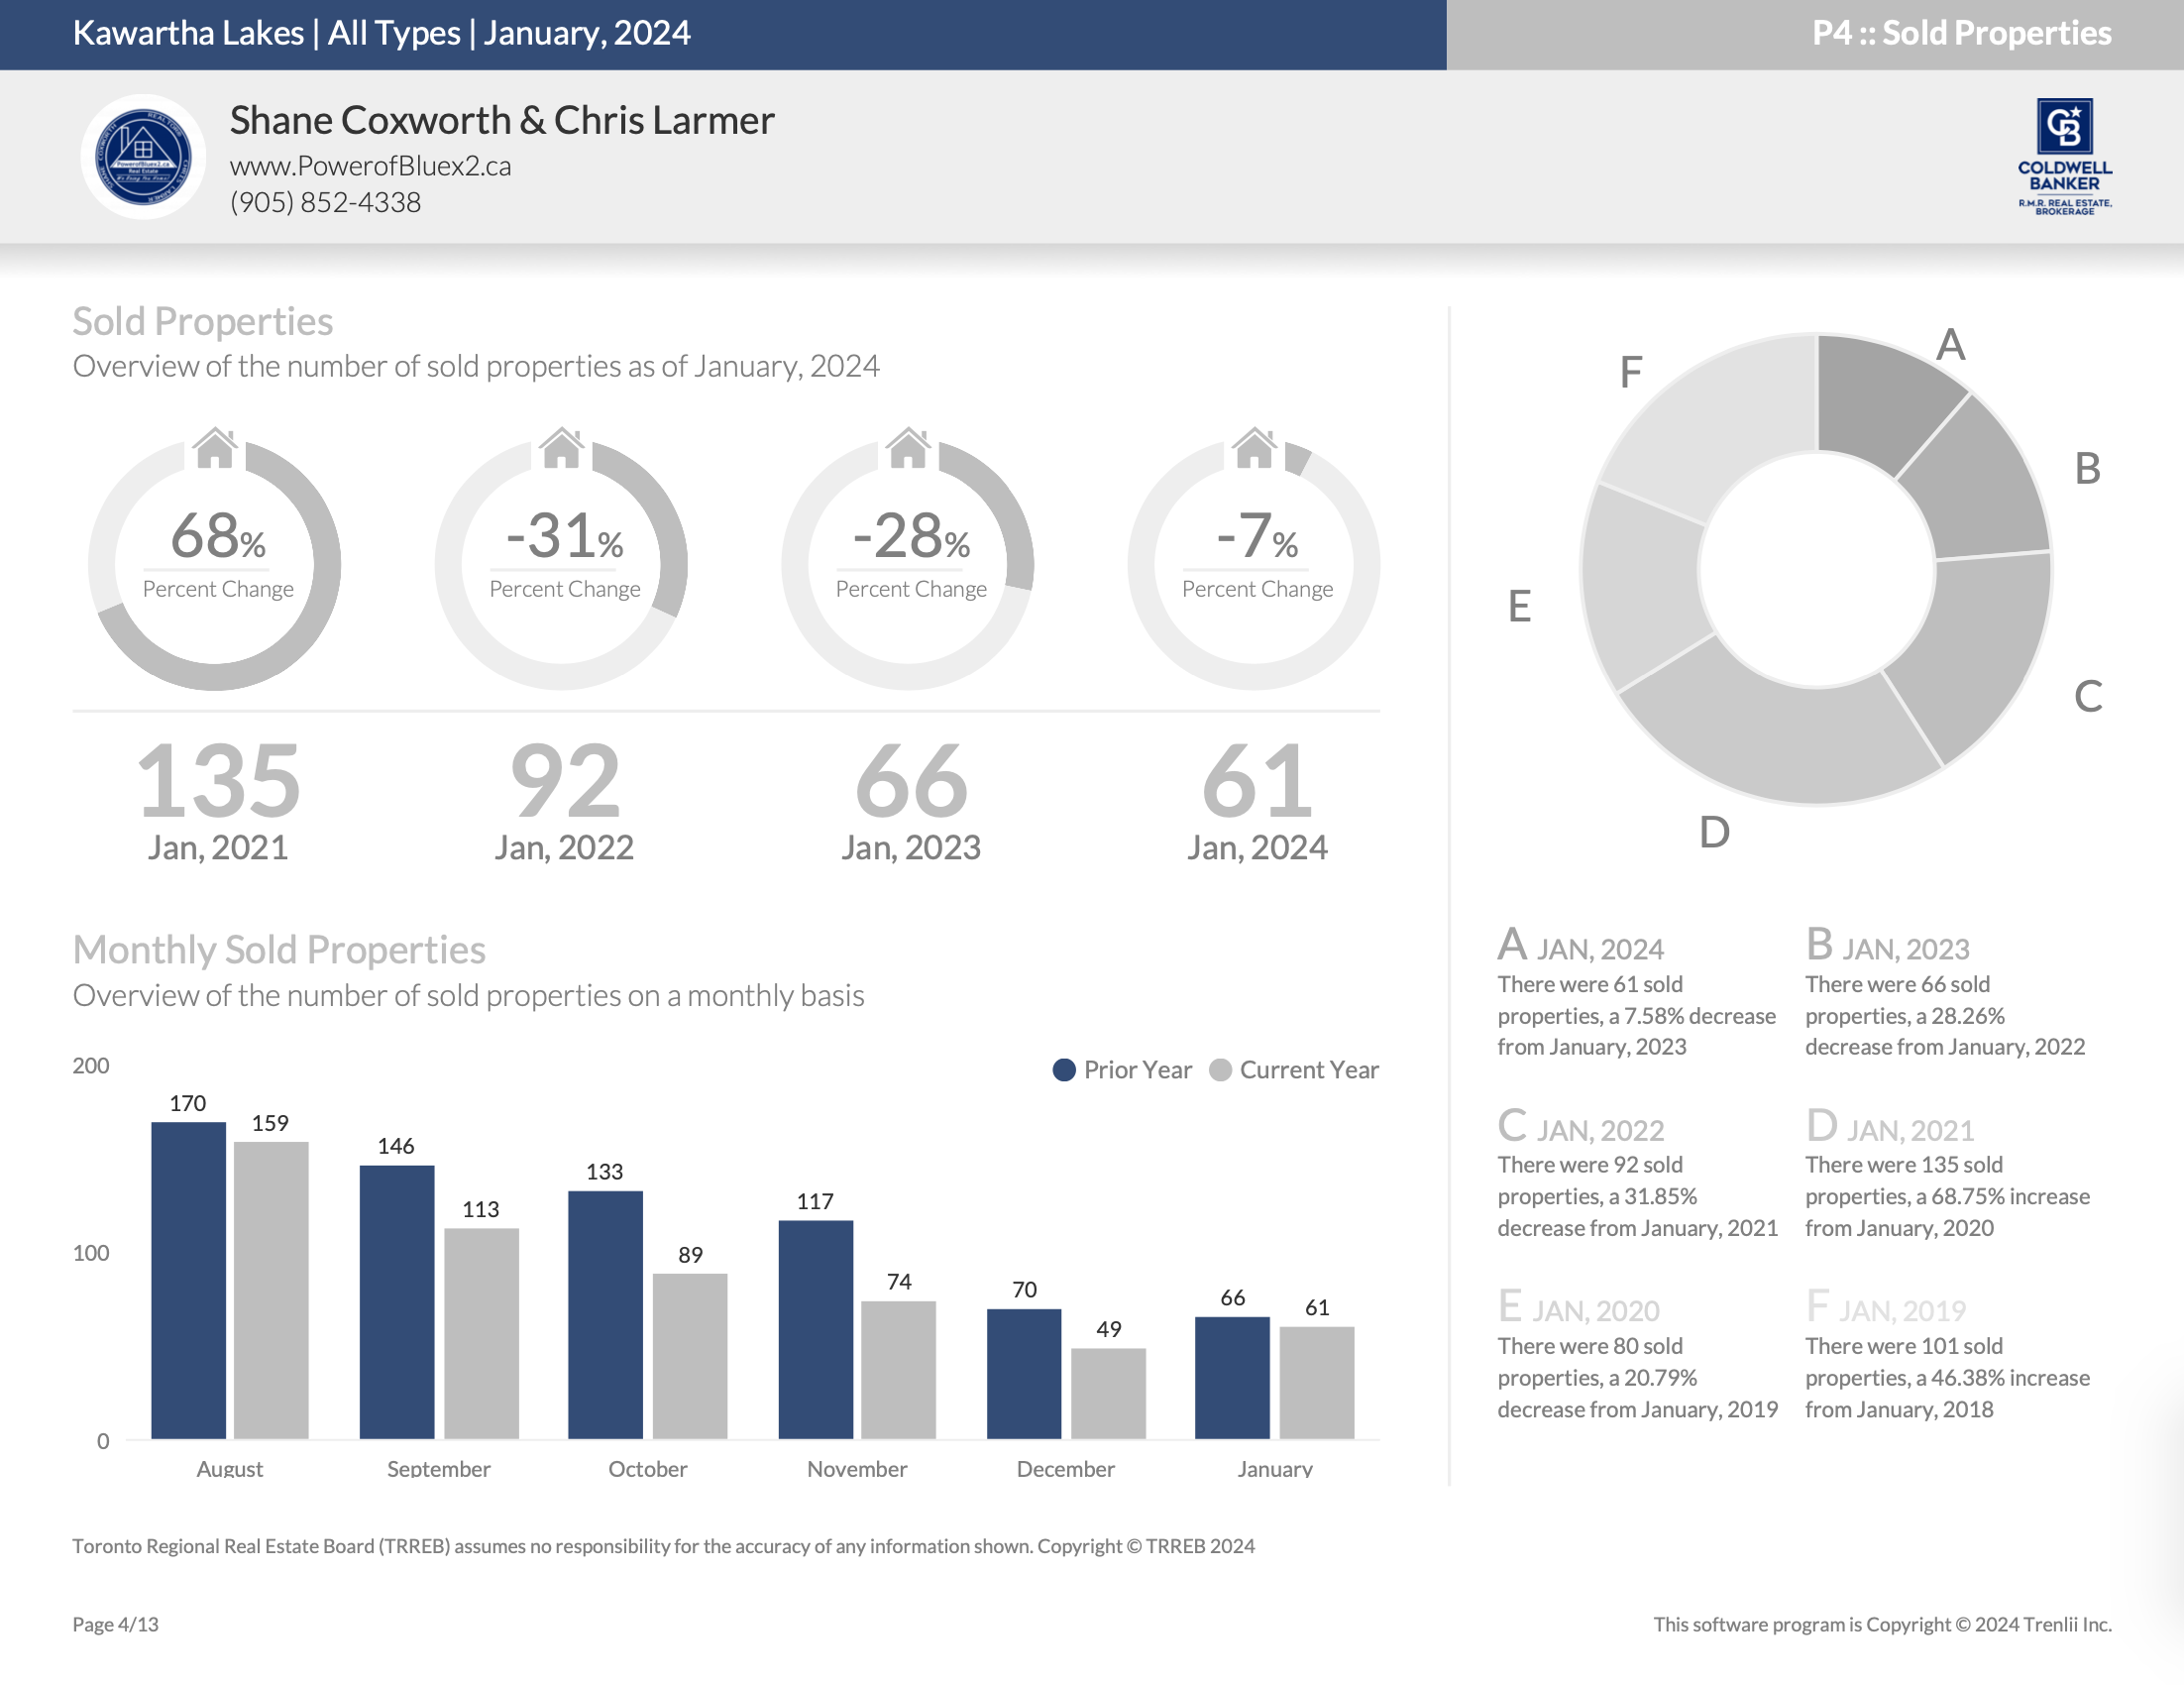
Here is the Kawartha Lakes Housing November 2023 report (all housing types), with reports from the Canadian Real Estate AssociationToronto Regional Real Estate Board  included.

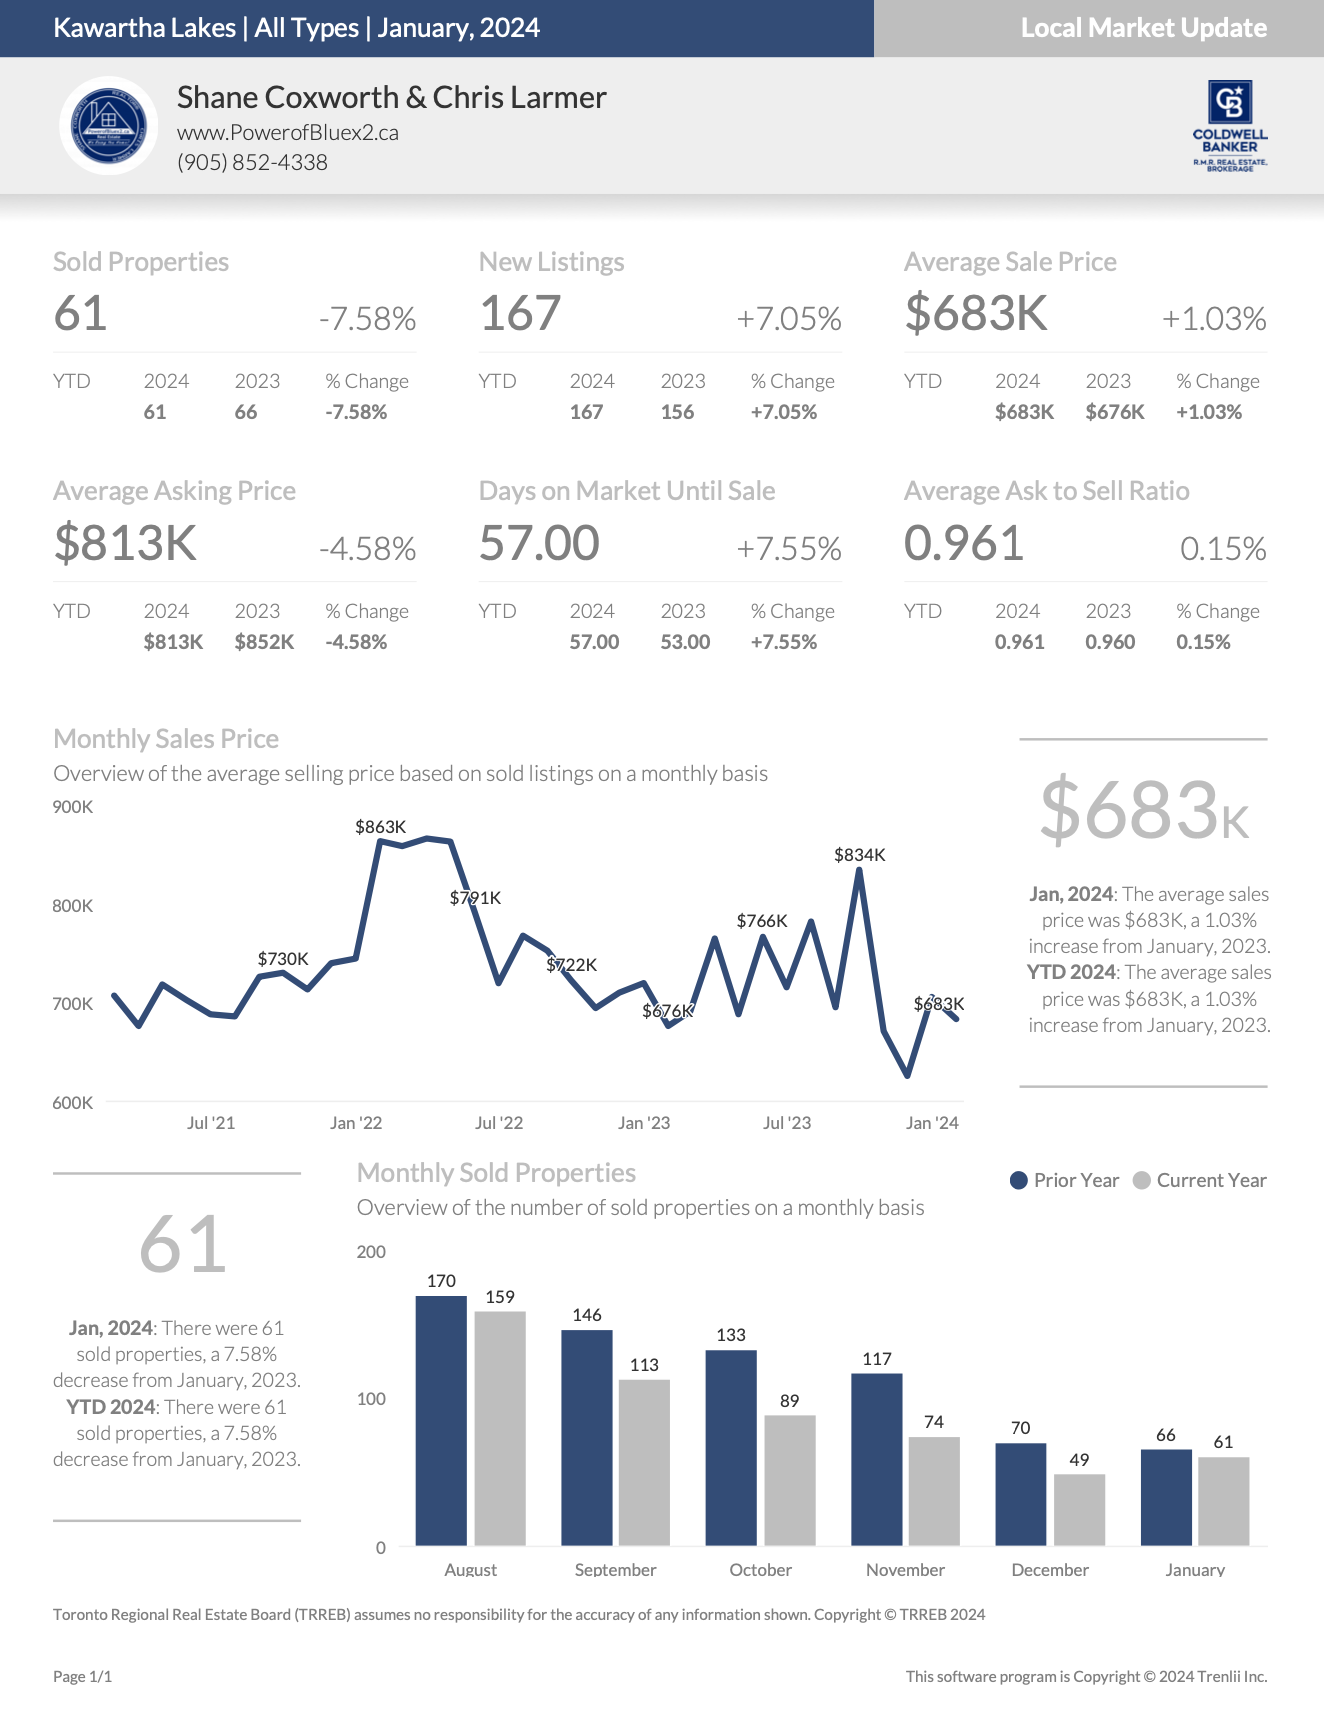
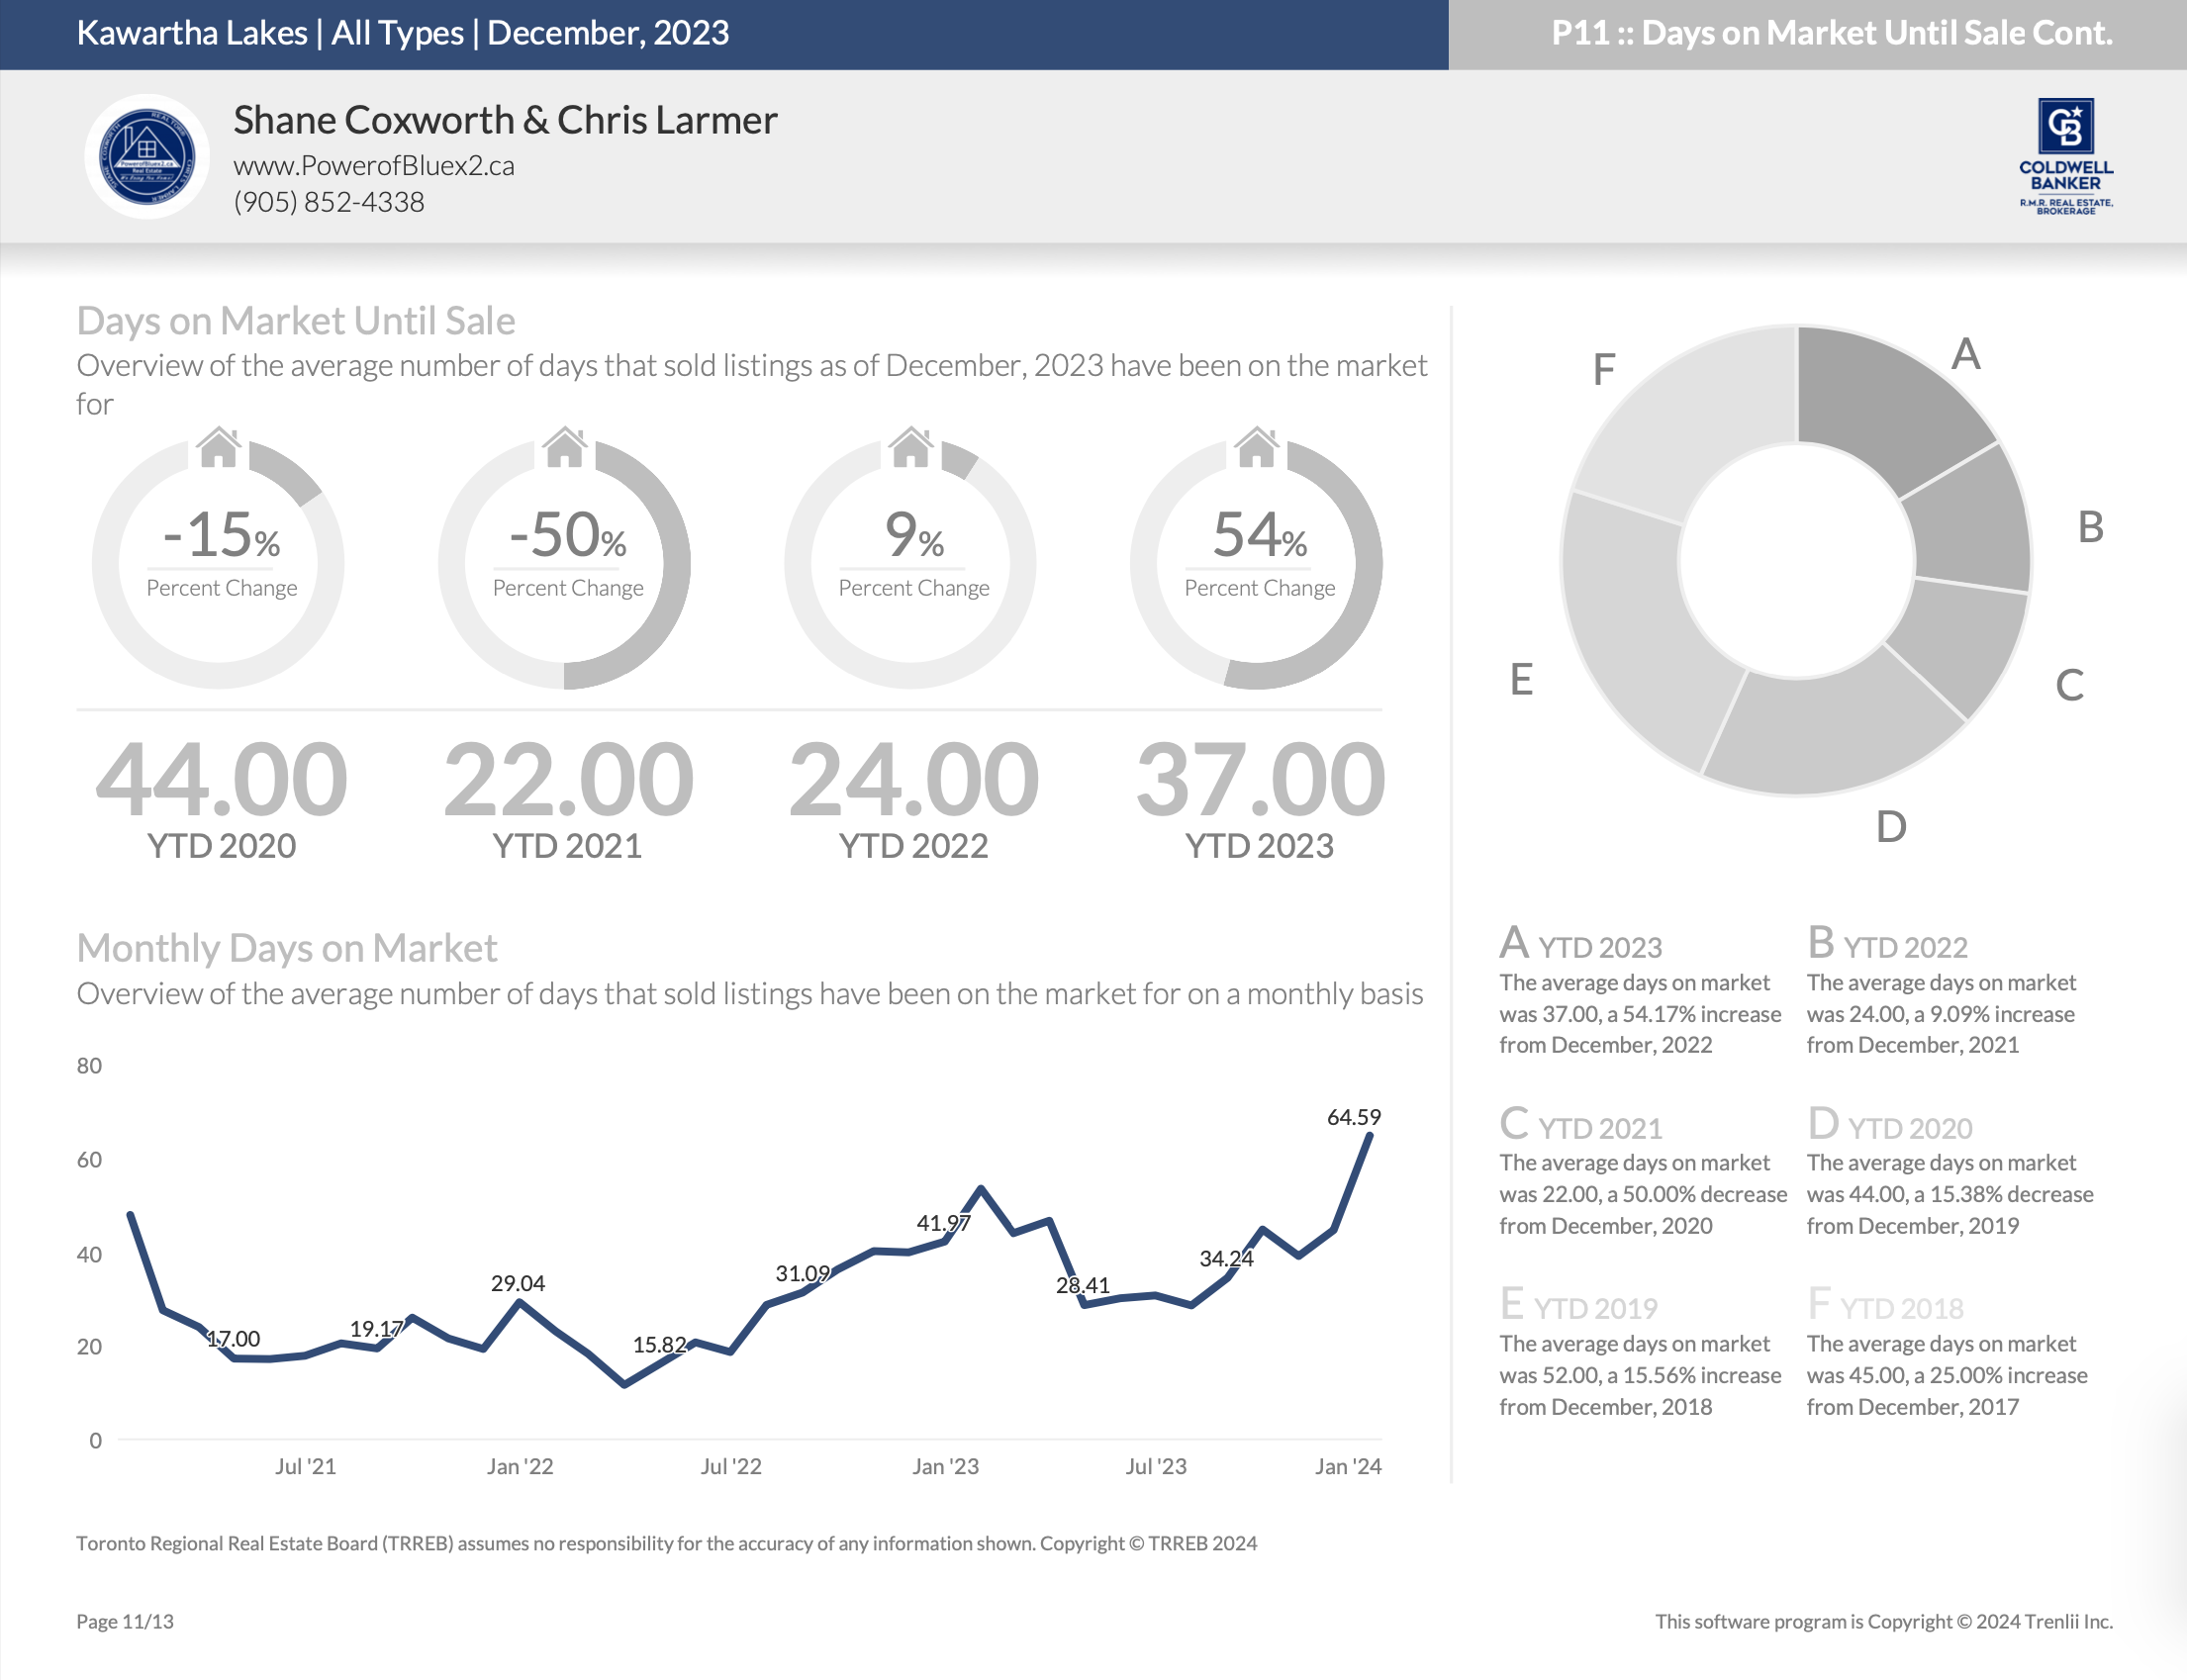
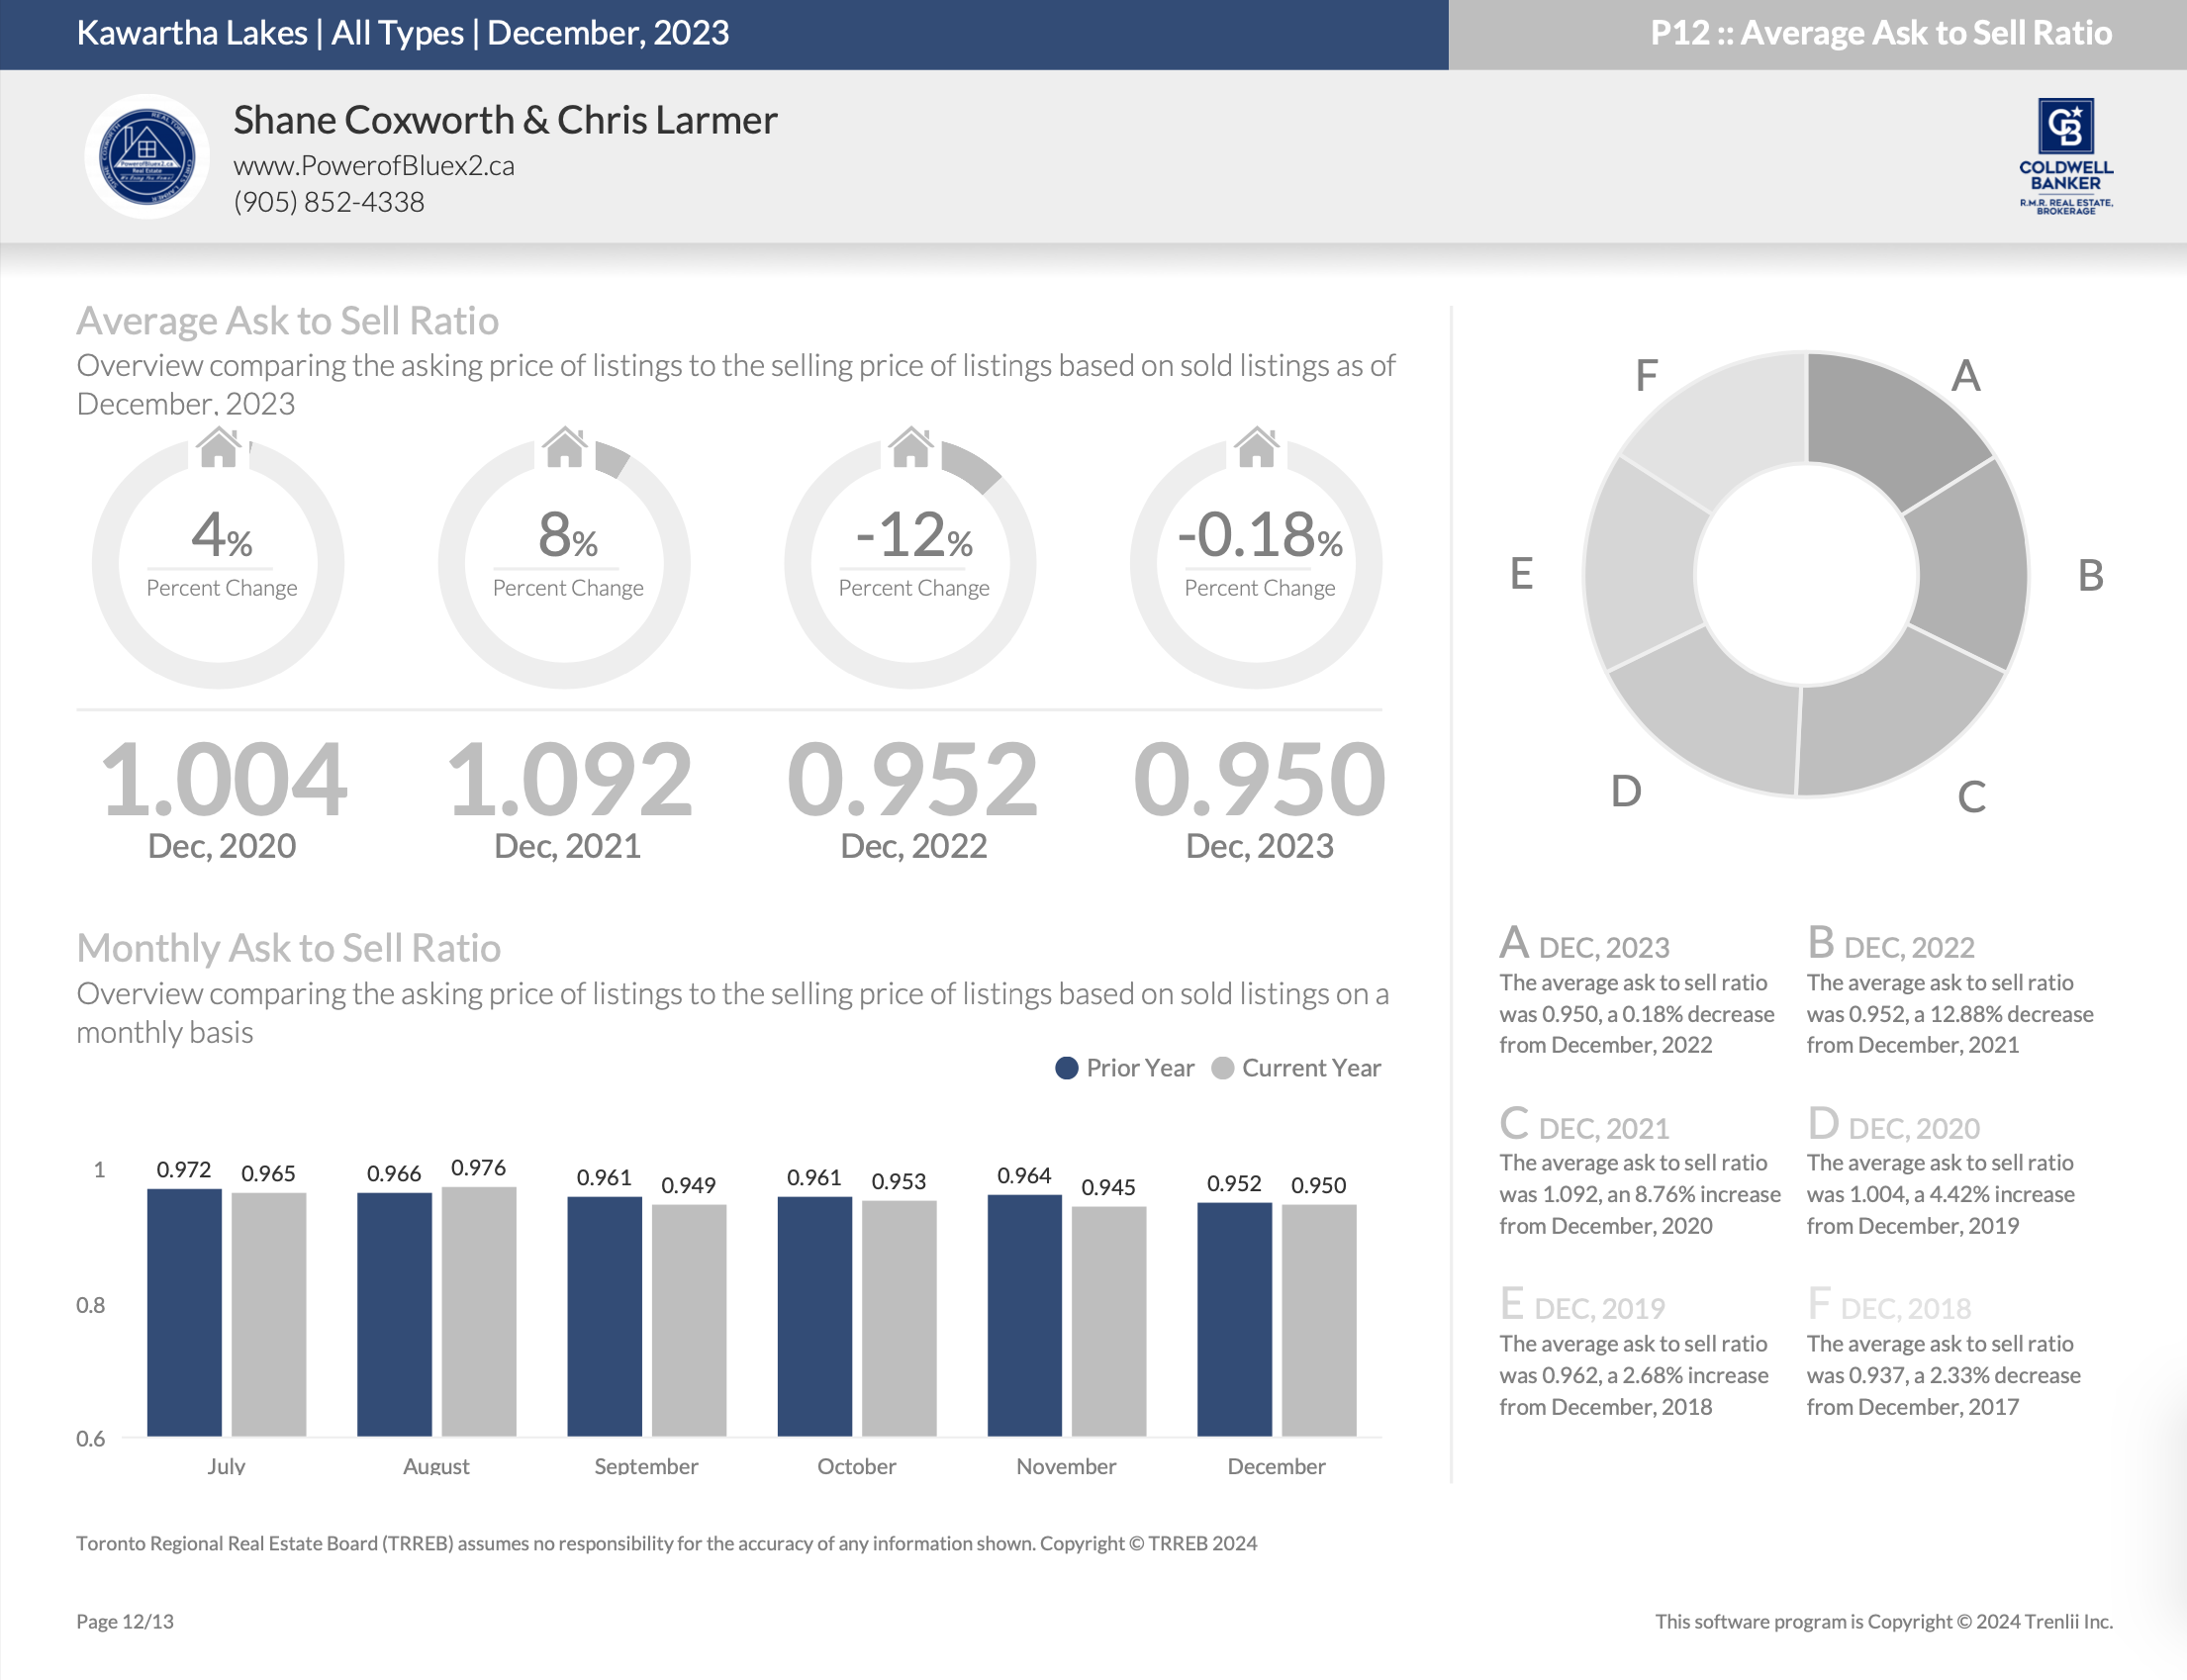
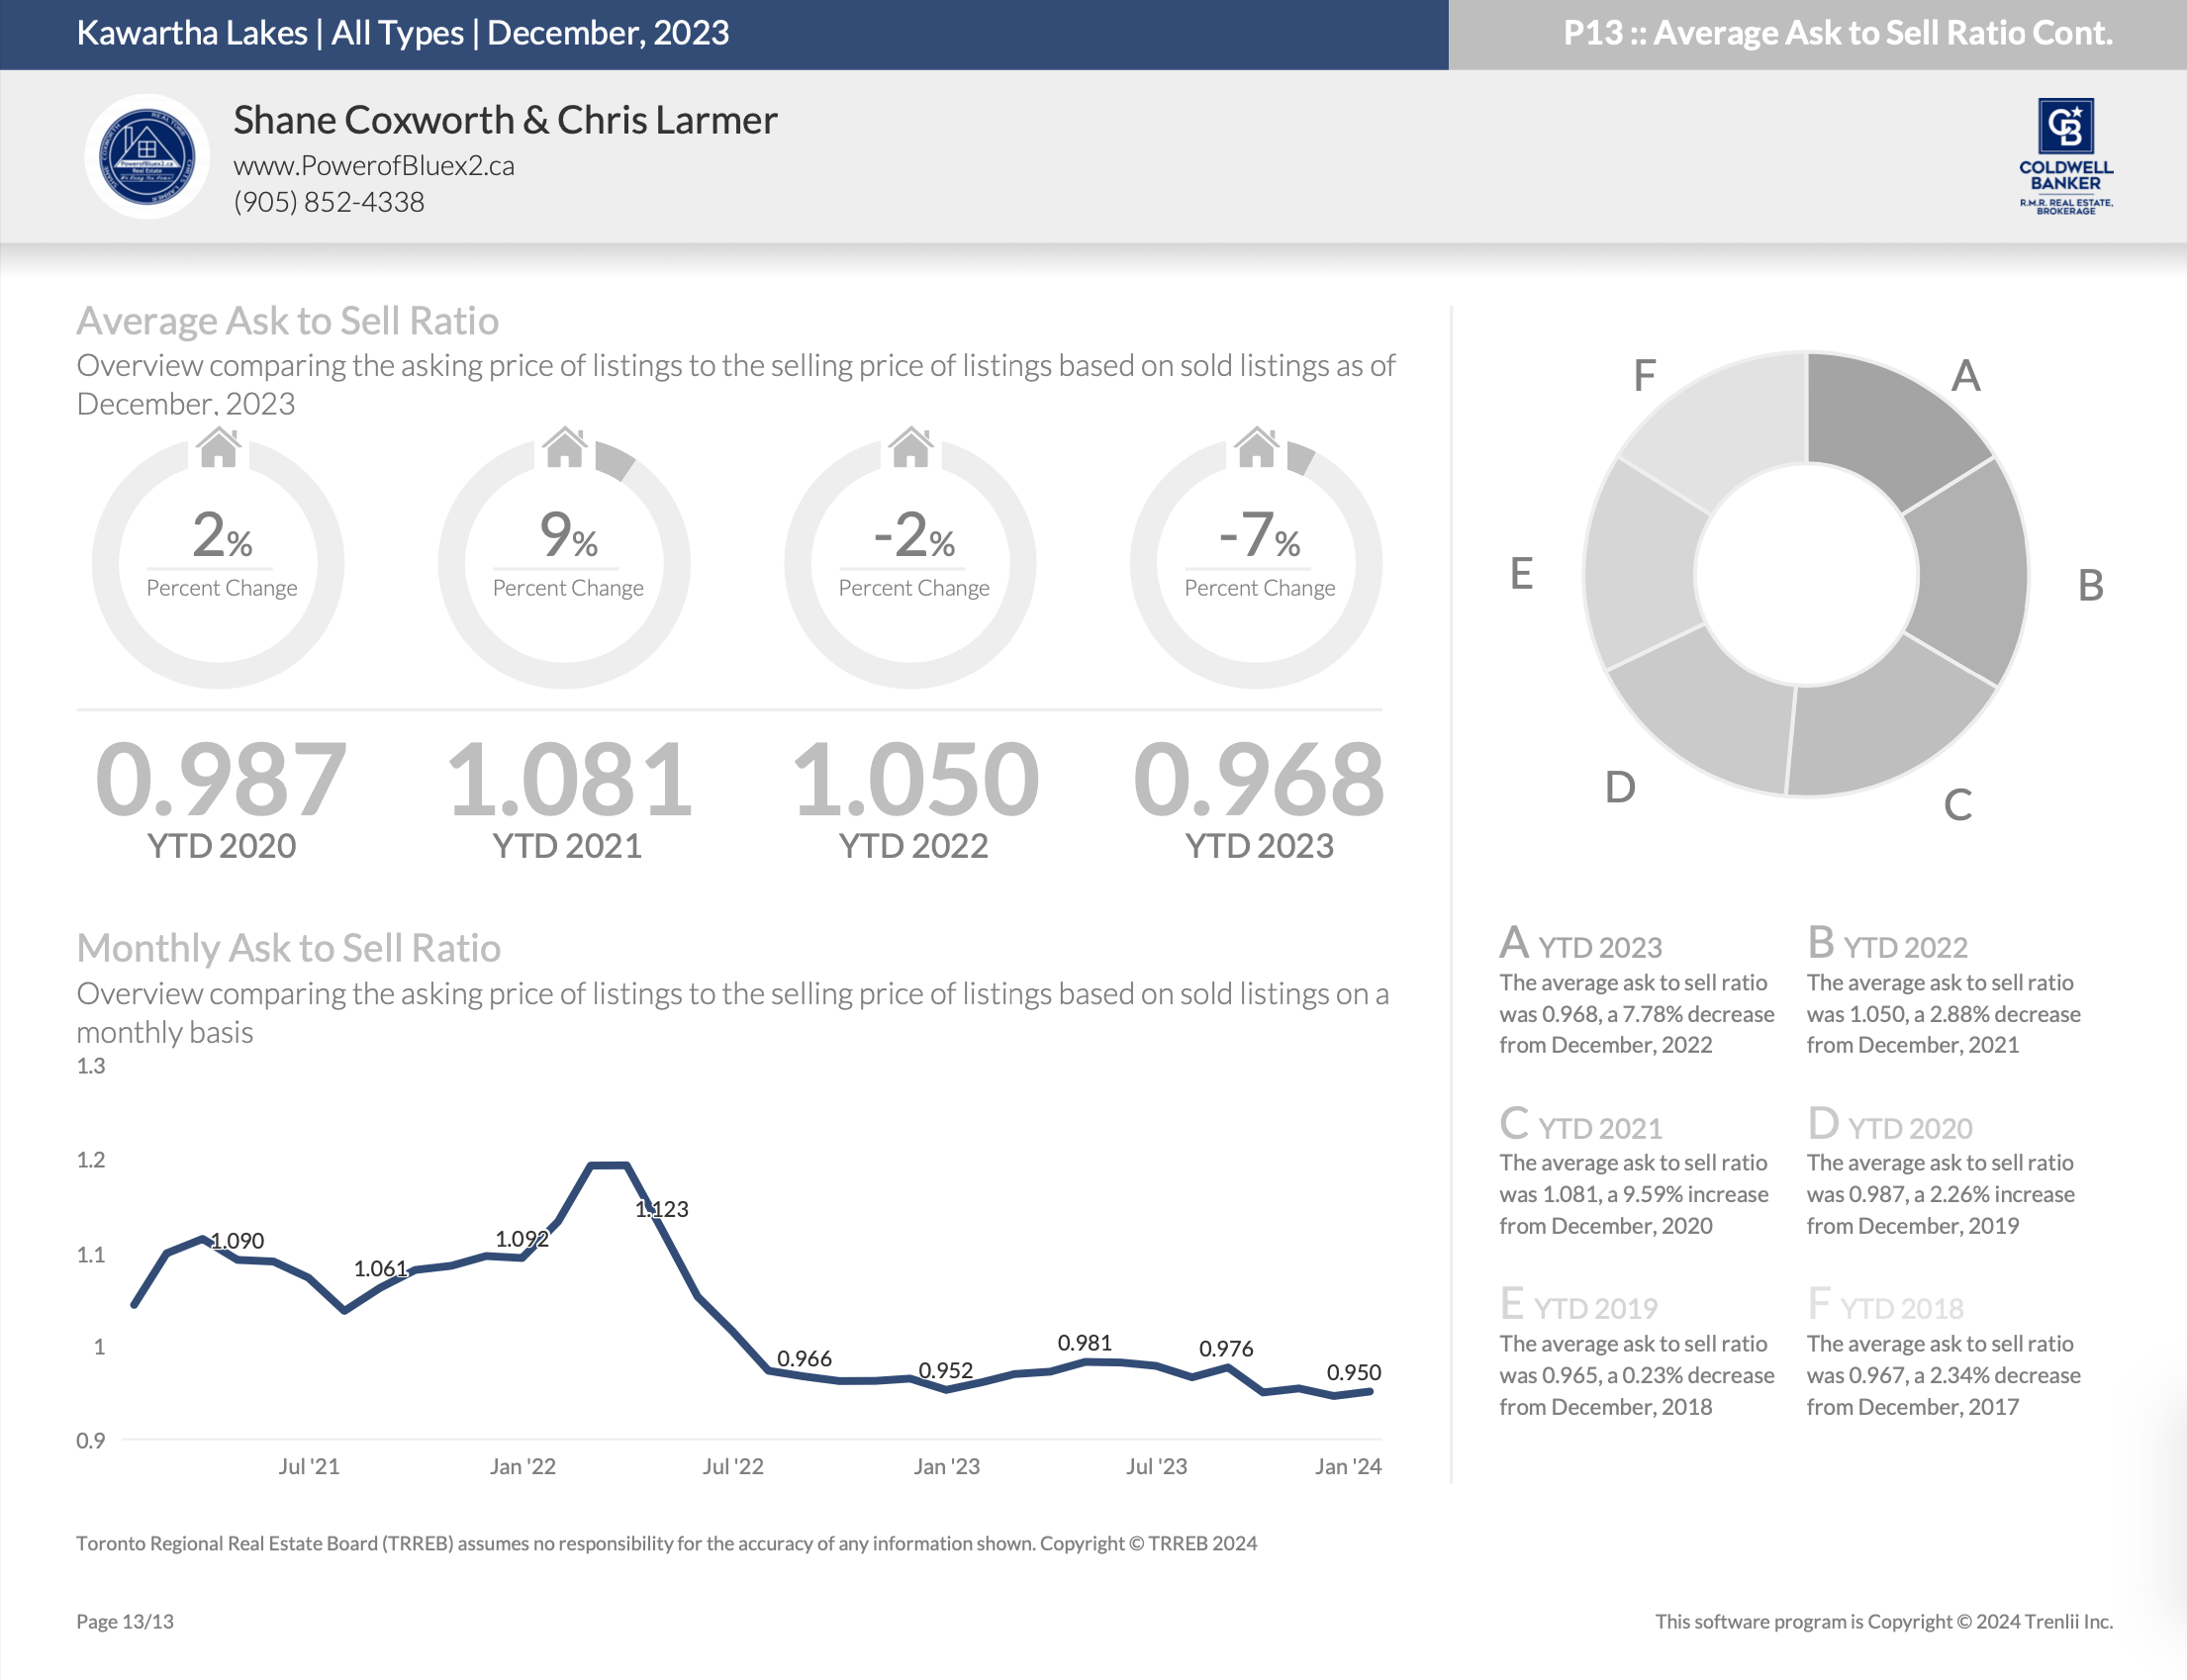
This housing report for Kawartha Lakes includes the number of new listings, average list price, number of properties sold, average selling price, average days on market and average asking price to selling price ratio for all property types within the Kawartha Lakes.


Scroll to the bottom for links to take you to the housing market reports for Durham, Uxbridge, Scugog and Brock.


CREA HOUSING MARKET REPORT – NOVEMBER 2023


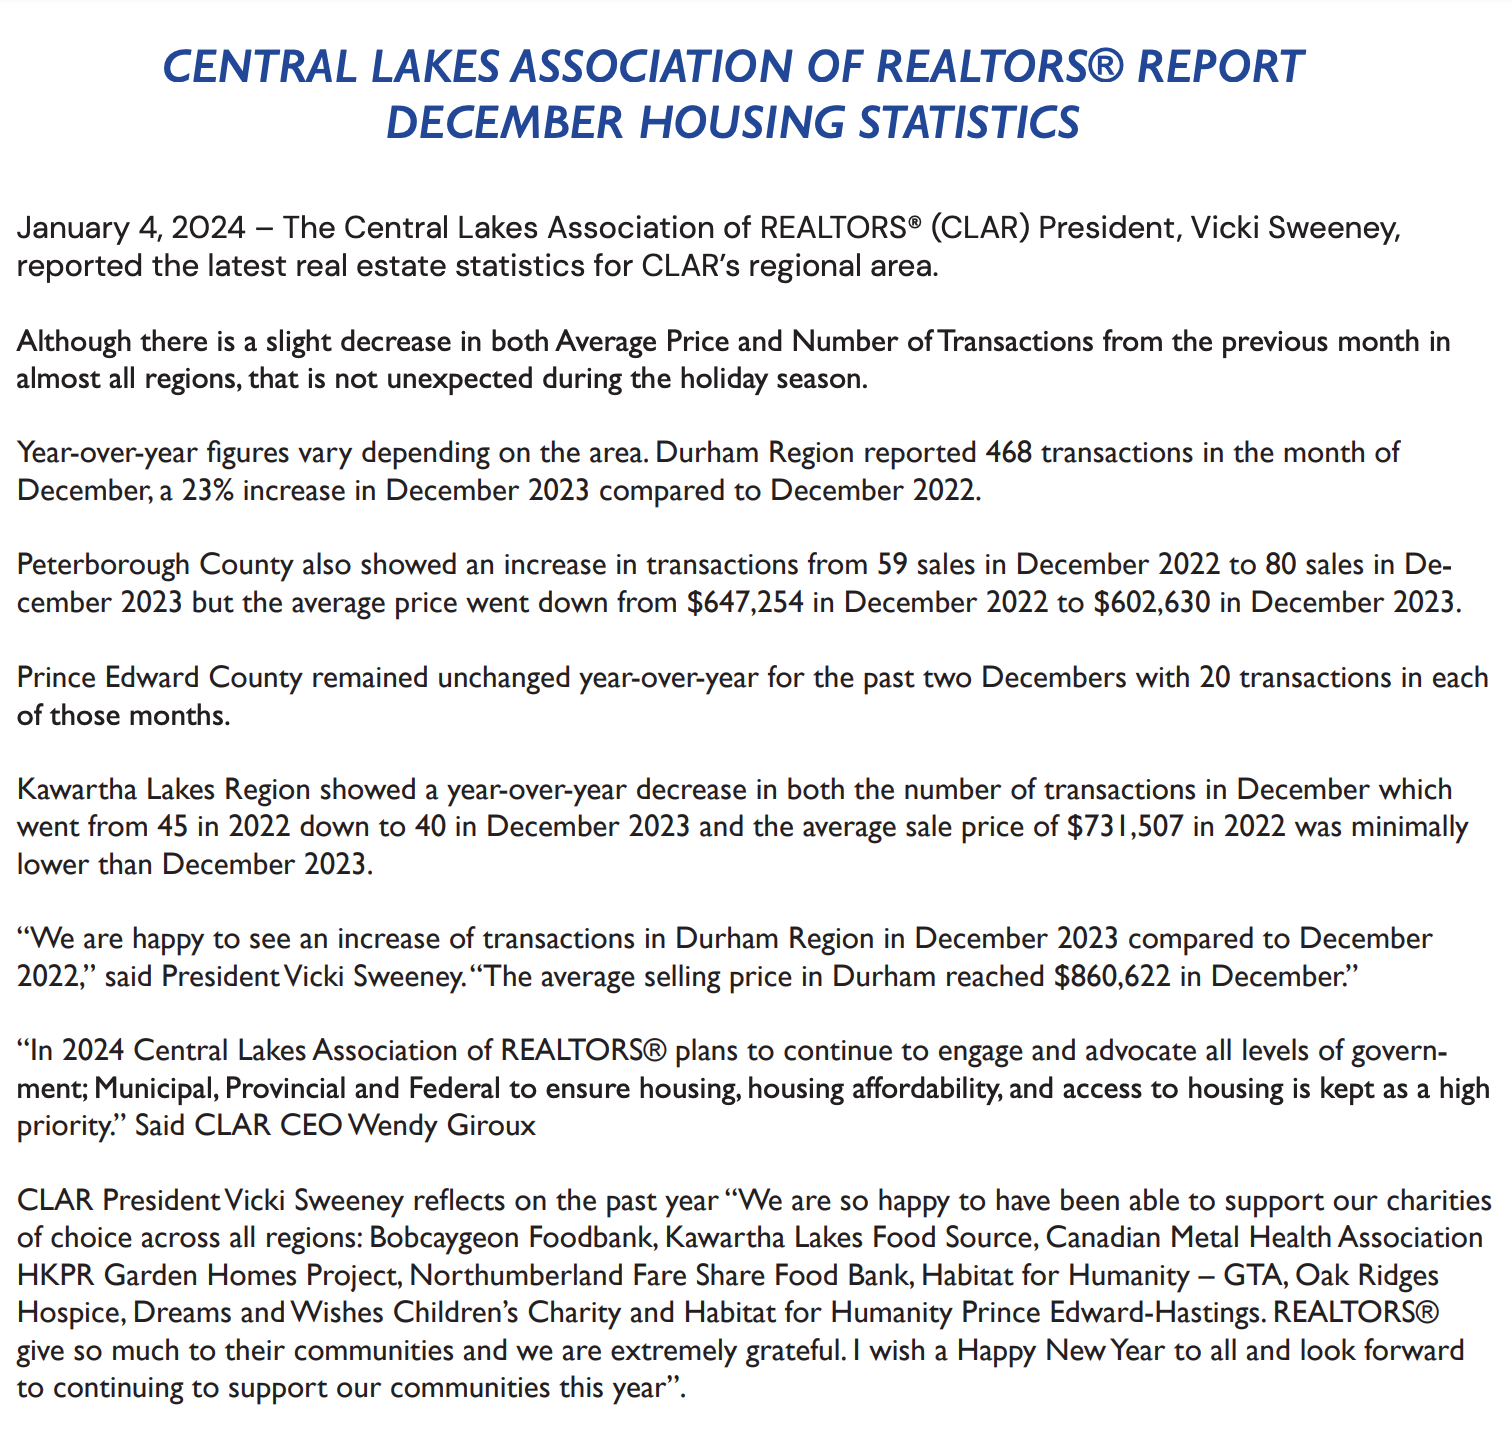
From Toronto Regional Real Estate Board

From Toronto Regional Real Estate Board

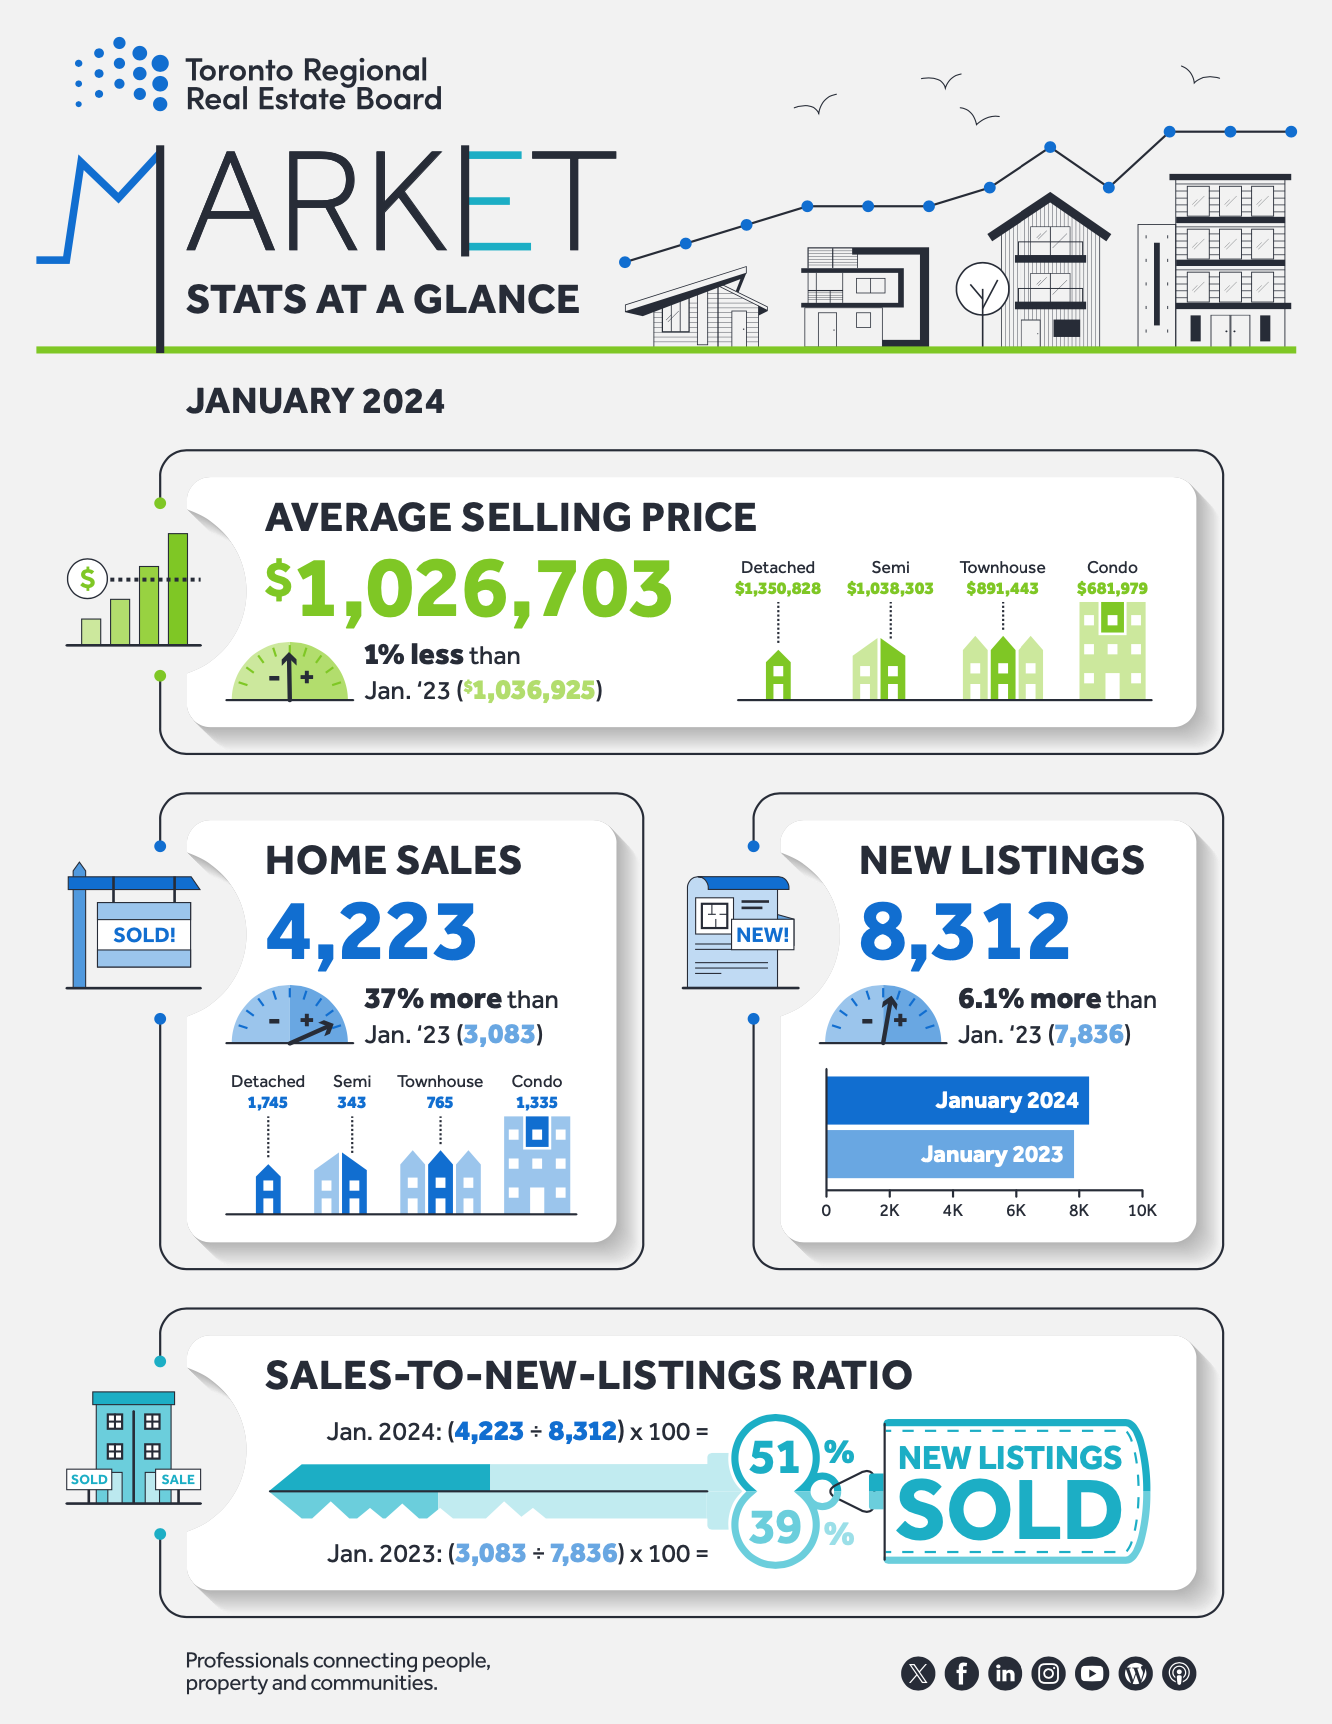
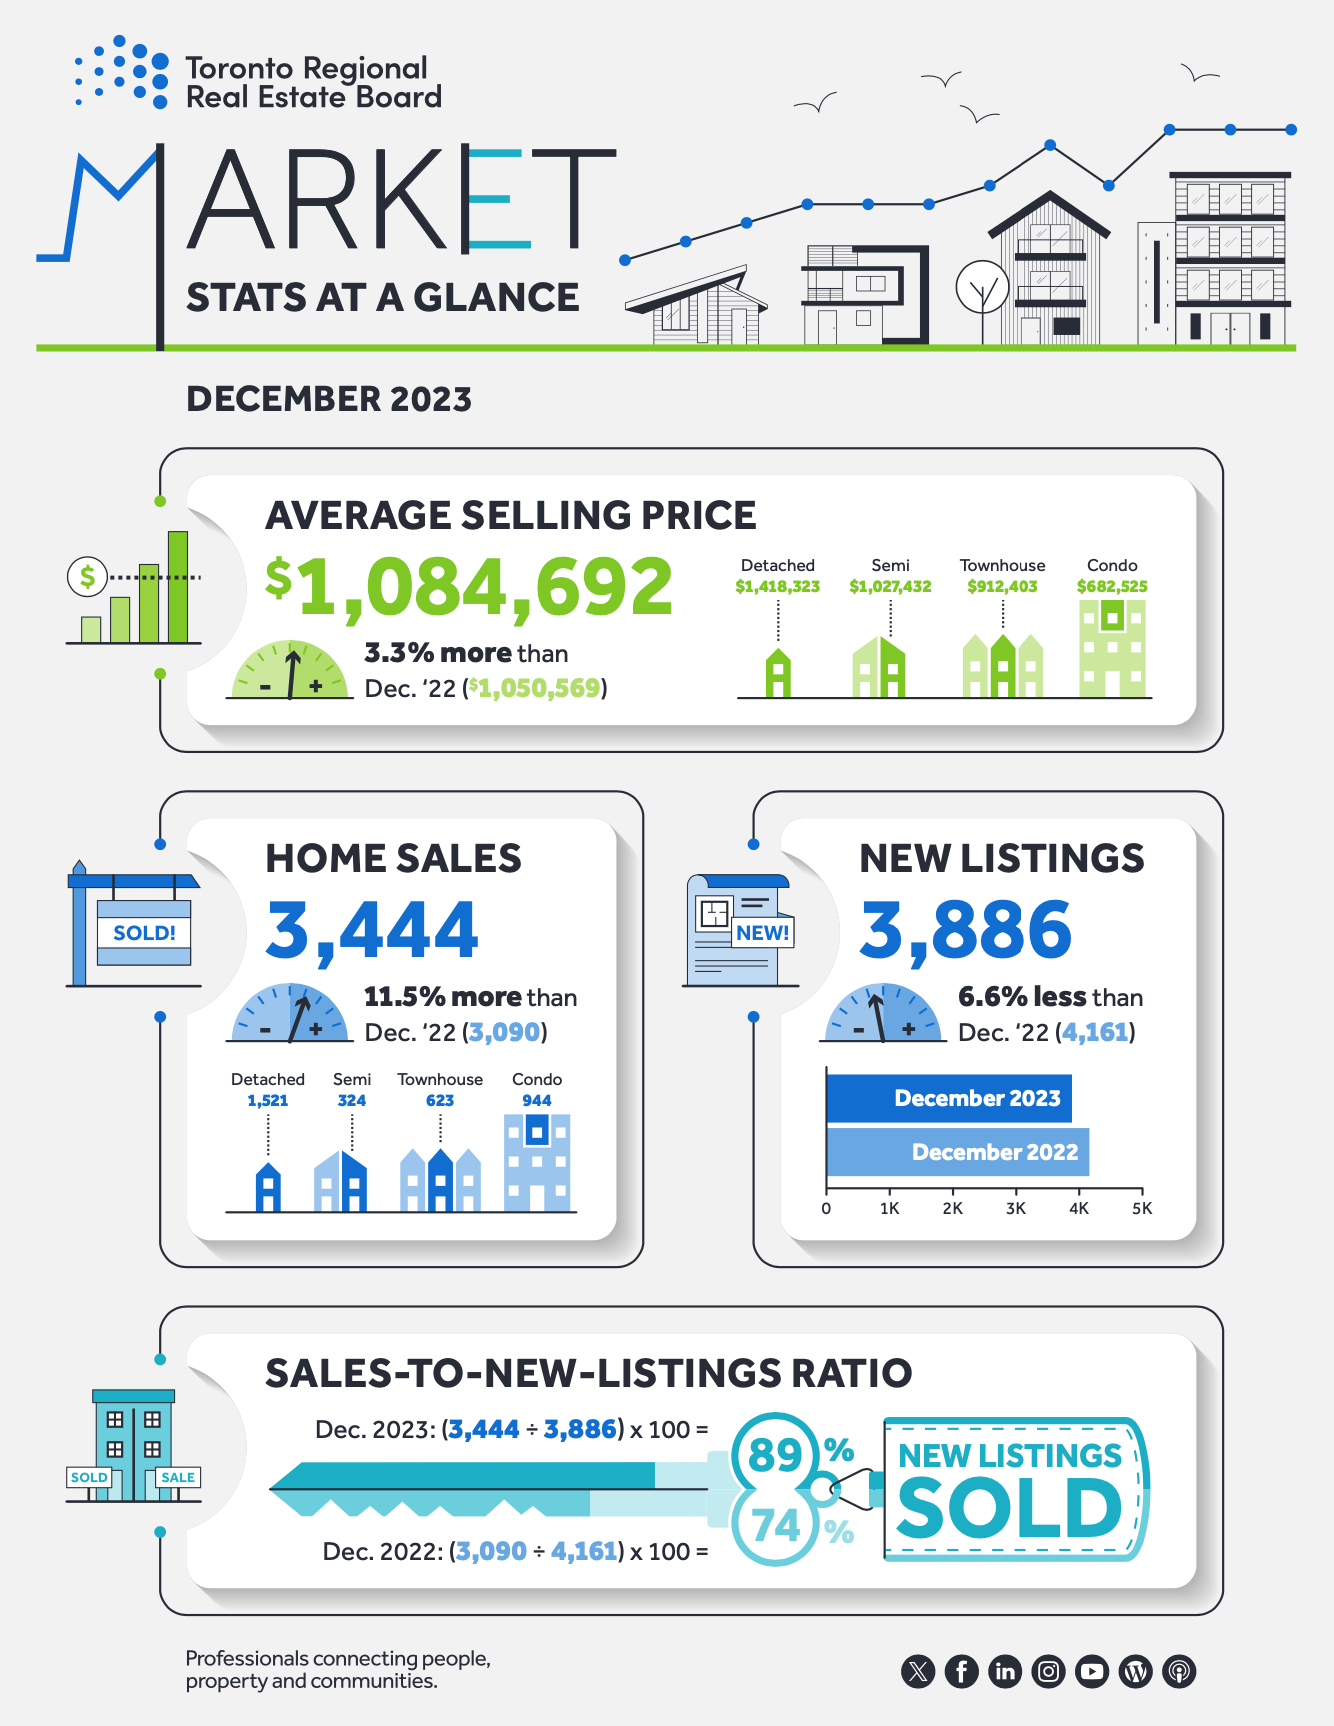
Toronto Regional Real Estate Board – Market Stats At A Glance – November 2023


Read the Toronto Regional Real Estate Board  Market Watch Report 


Kawartha Lakes

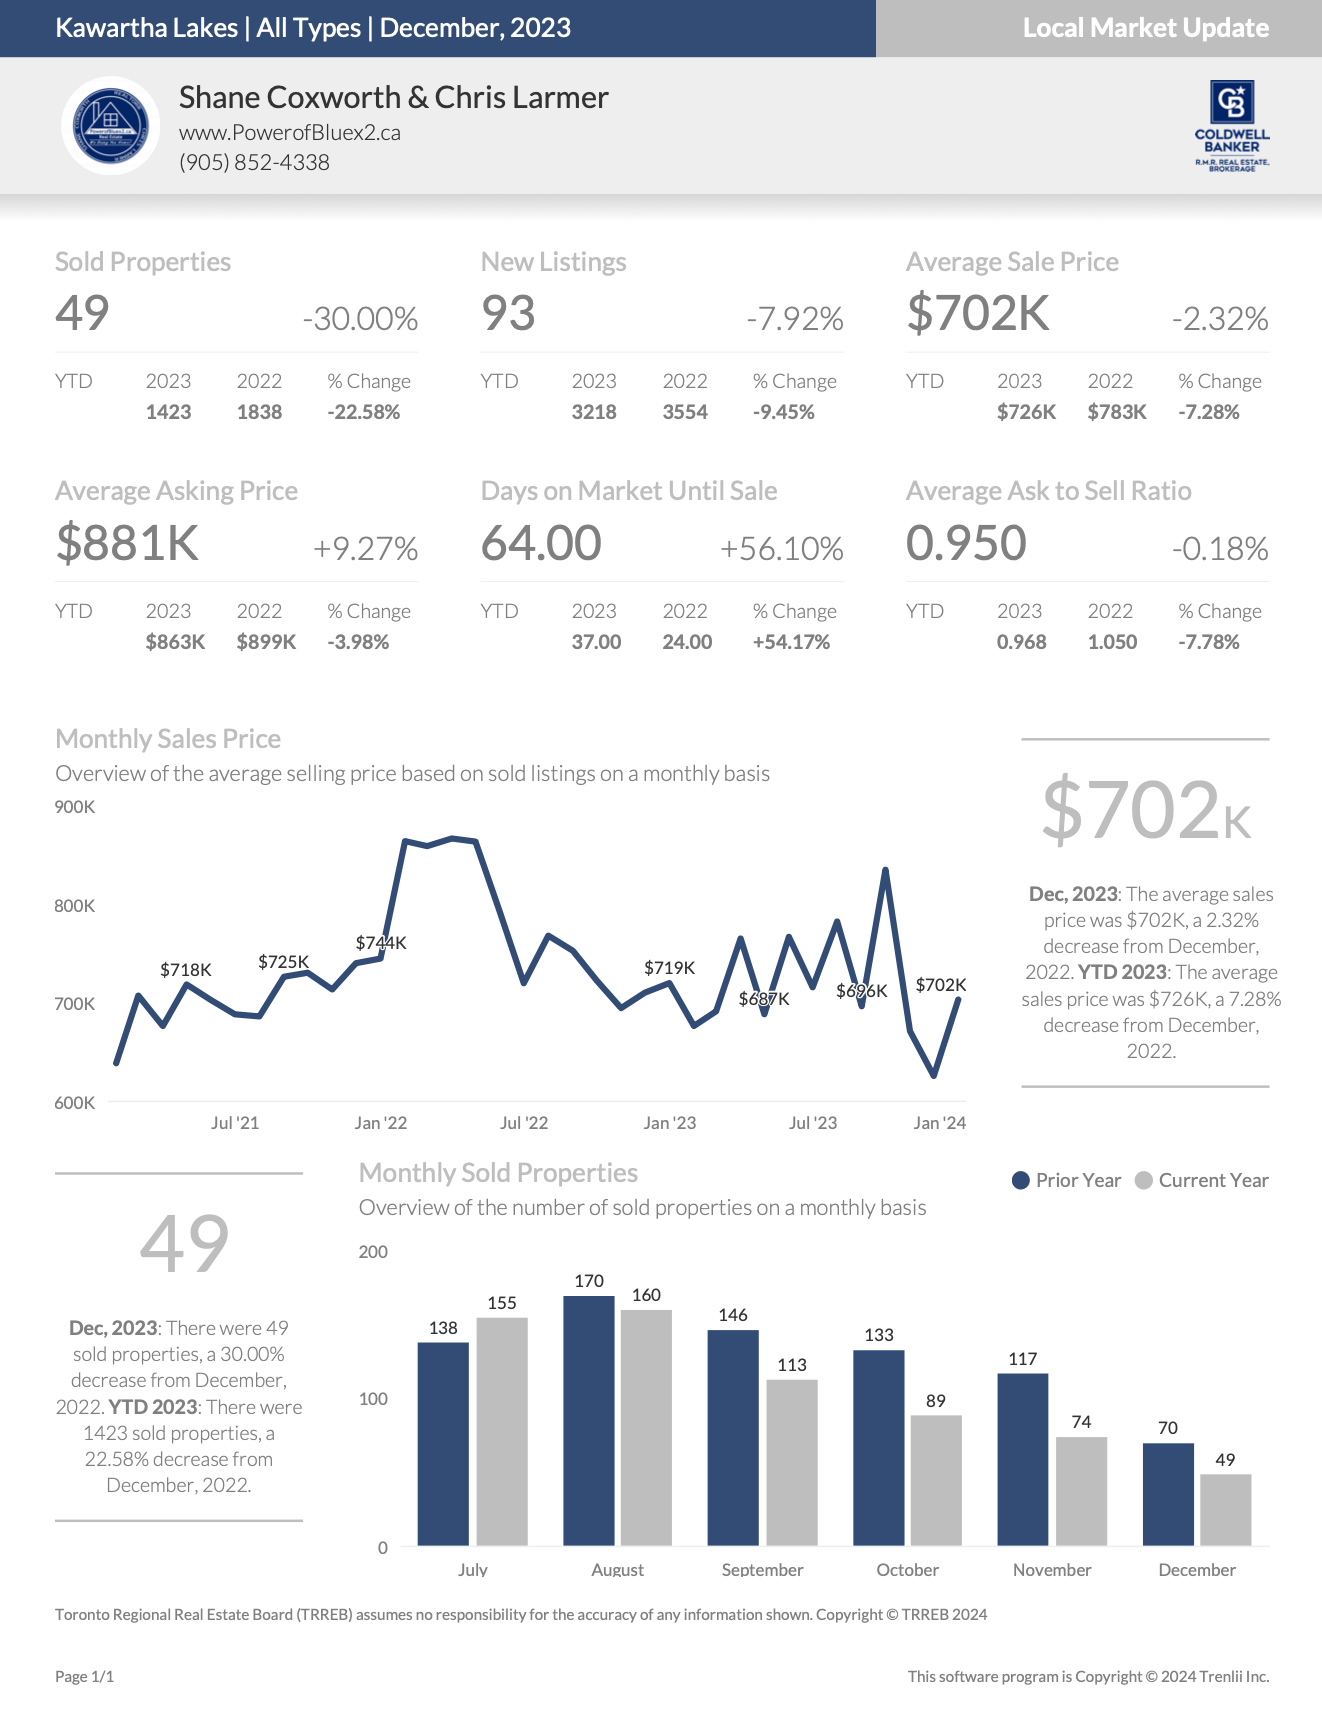
Kawartha Lakes Full Report

*Some values may vary slightly based on the exact date and time the reports were generated.


Kawartha Lakes Housing November 2023


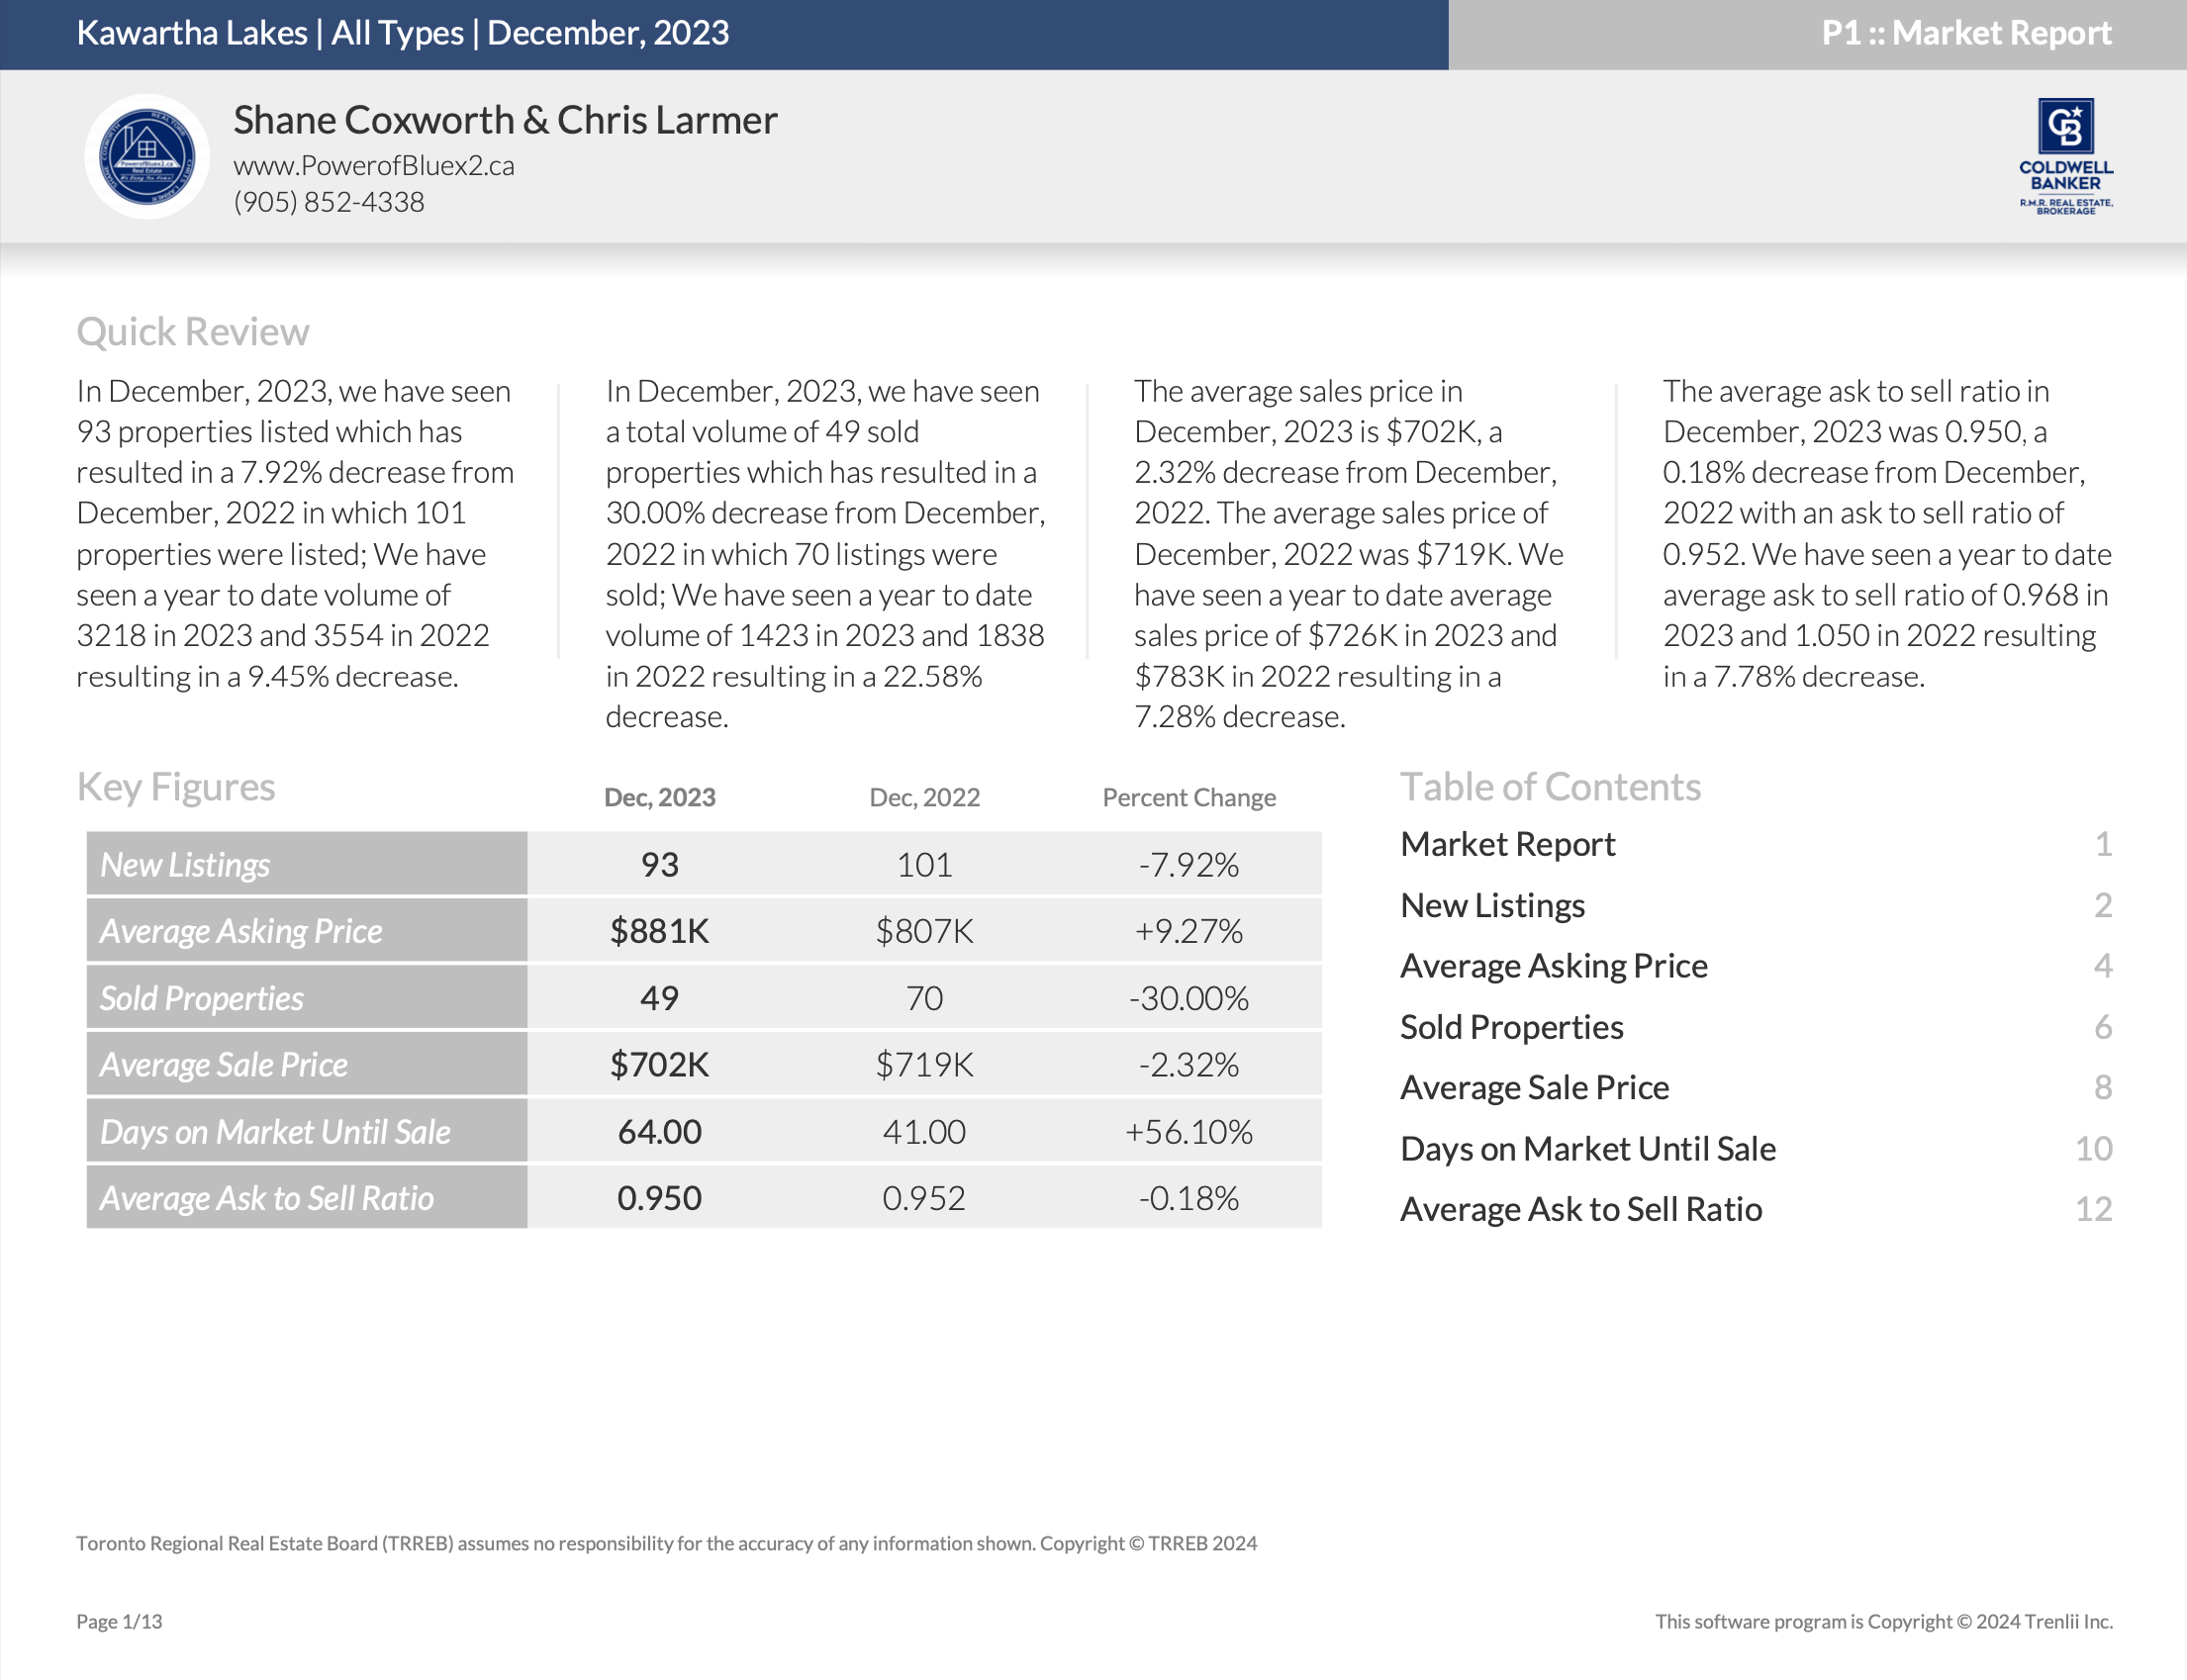
Quick Review

Kawartha Lakes Housing November 2023


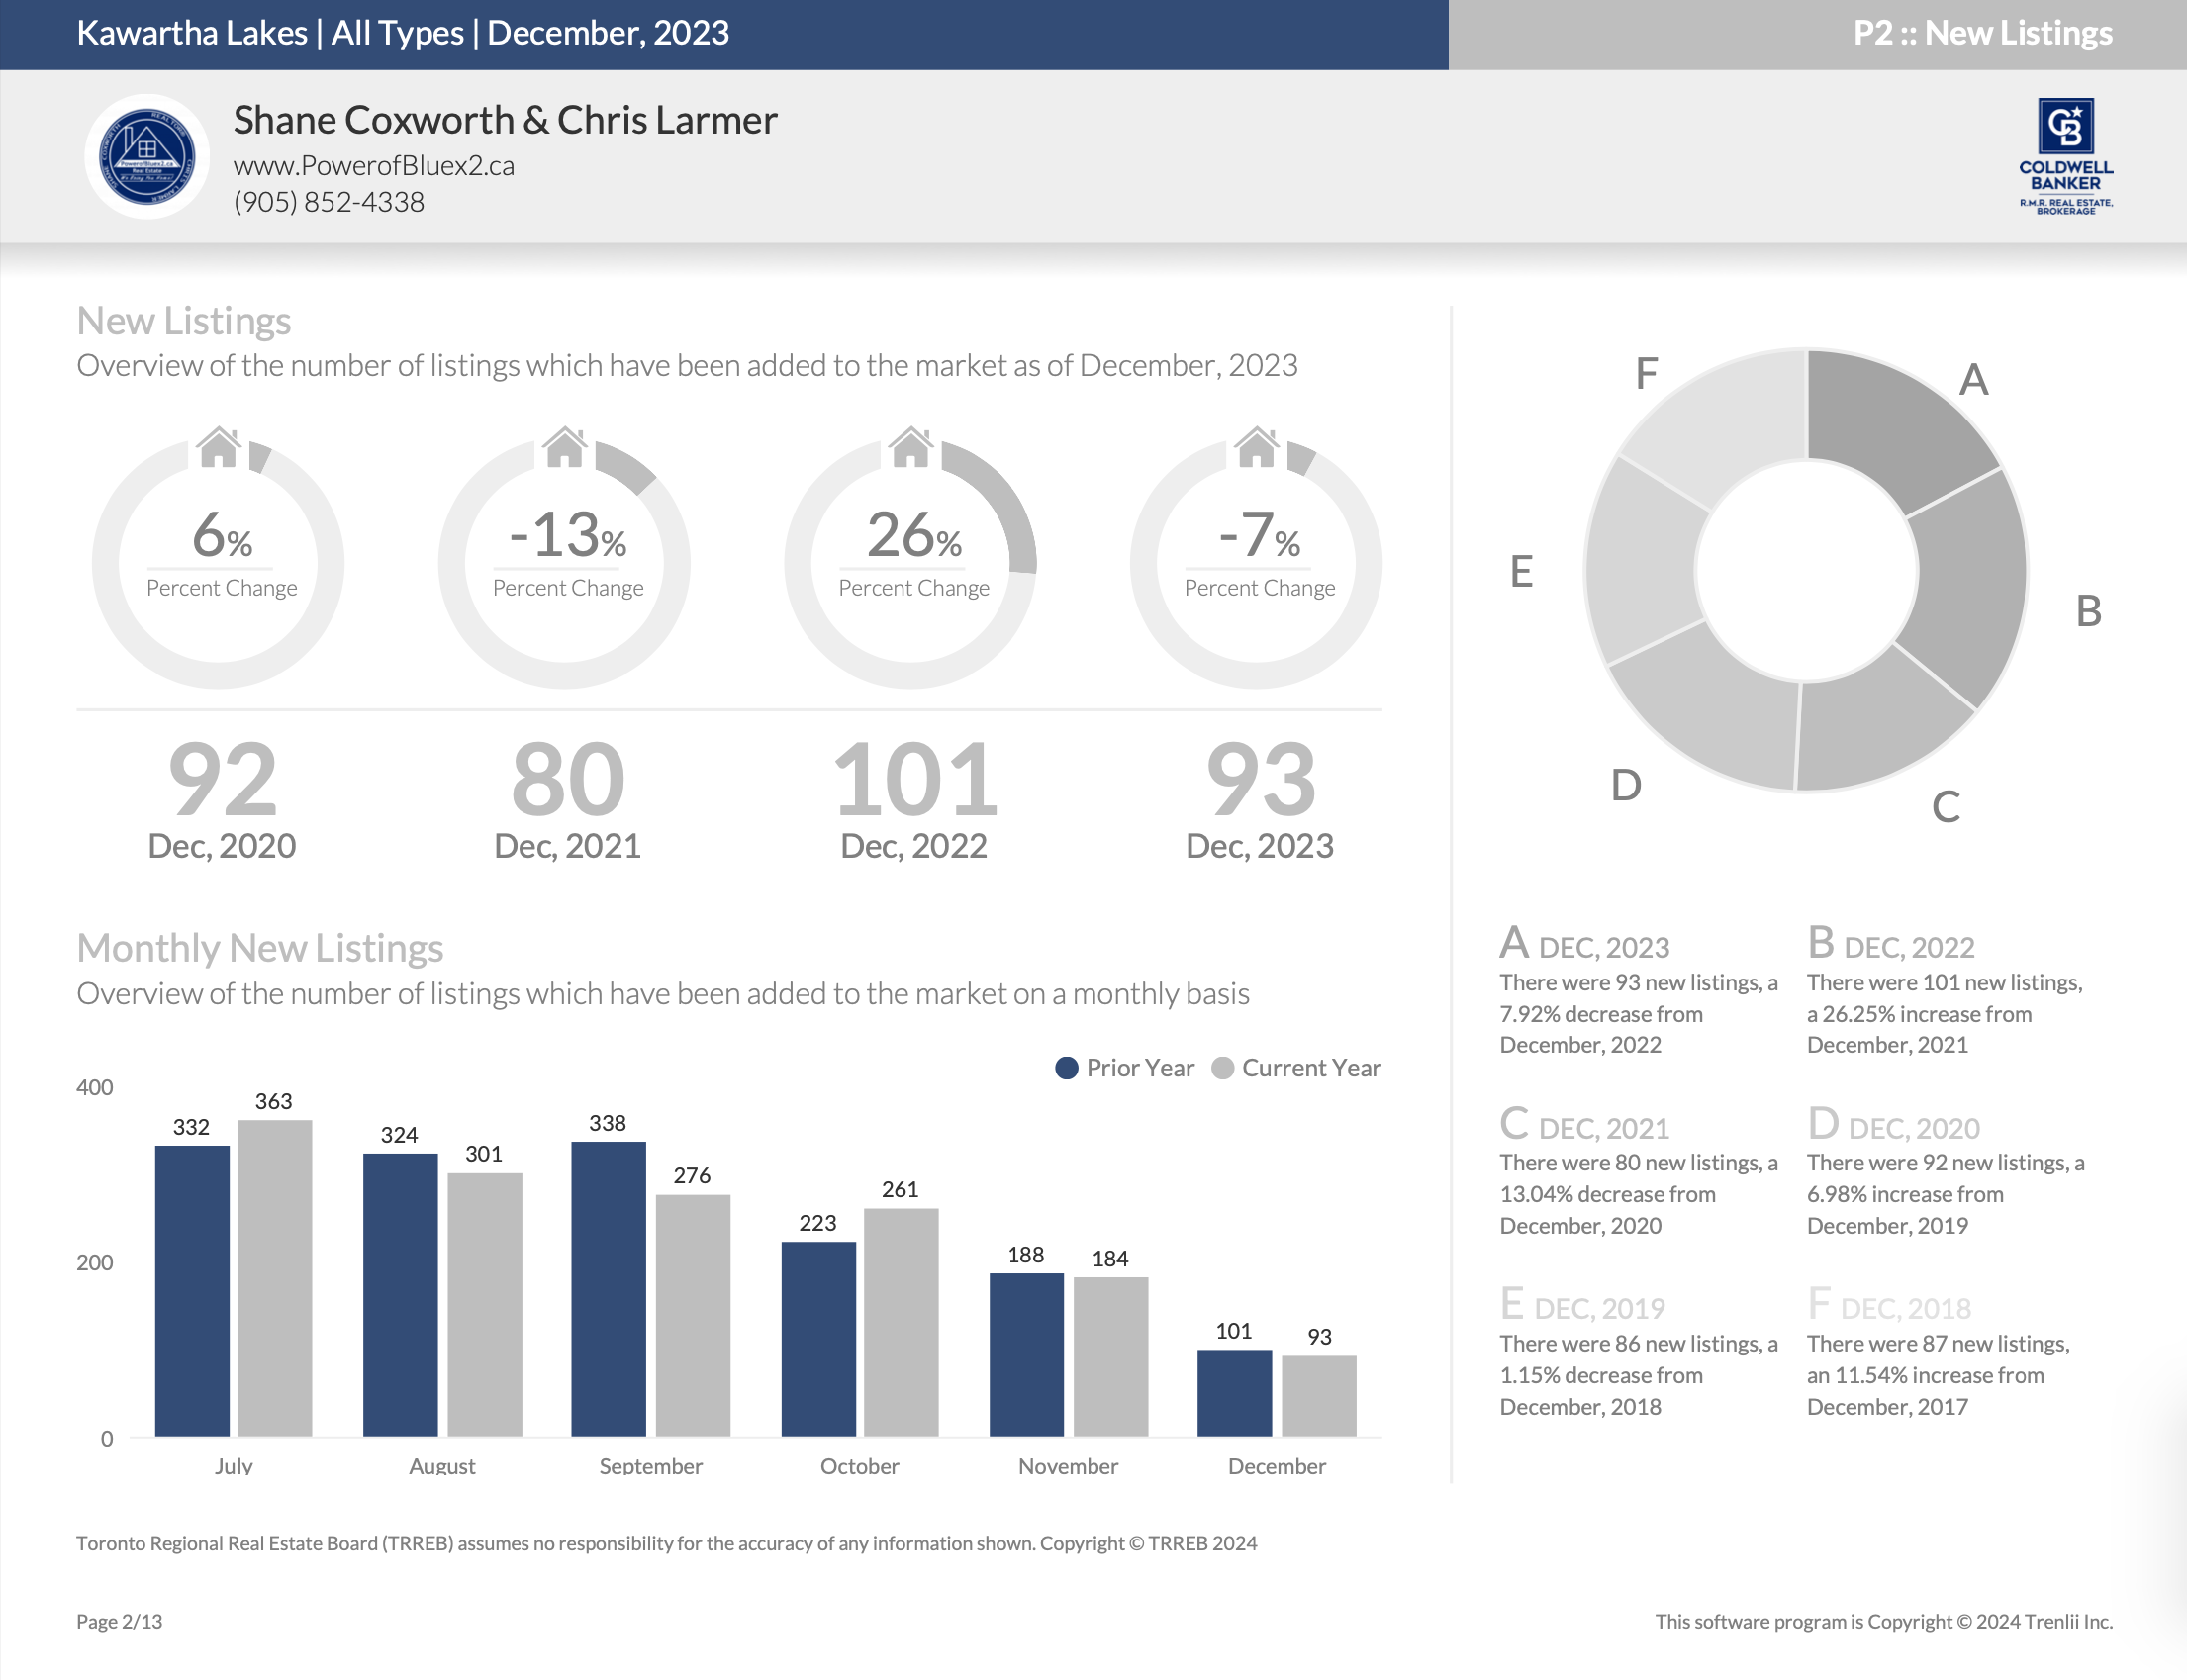
New Listings – November 2023

Kawartha Lakes Housing November 2023


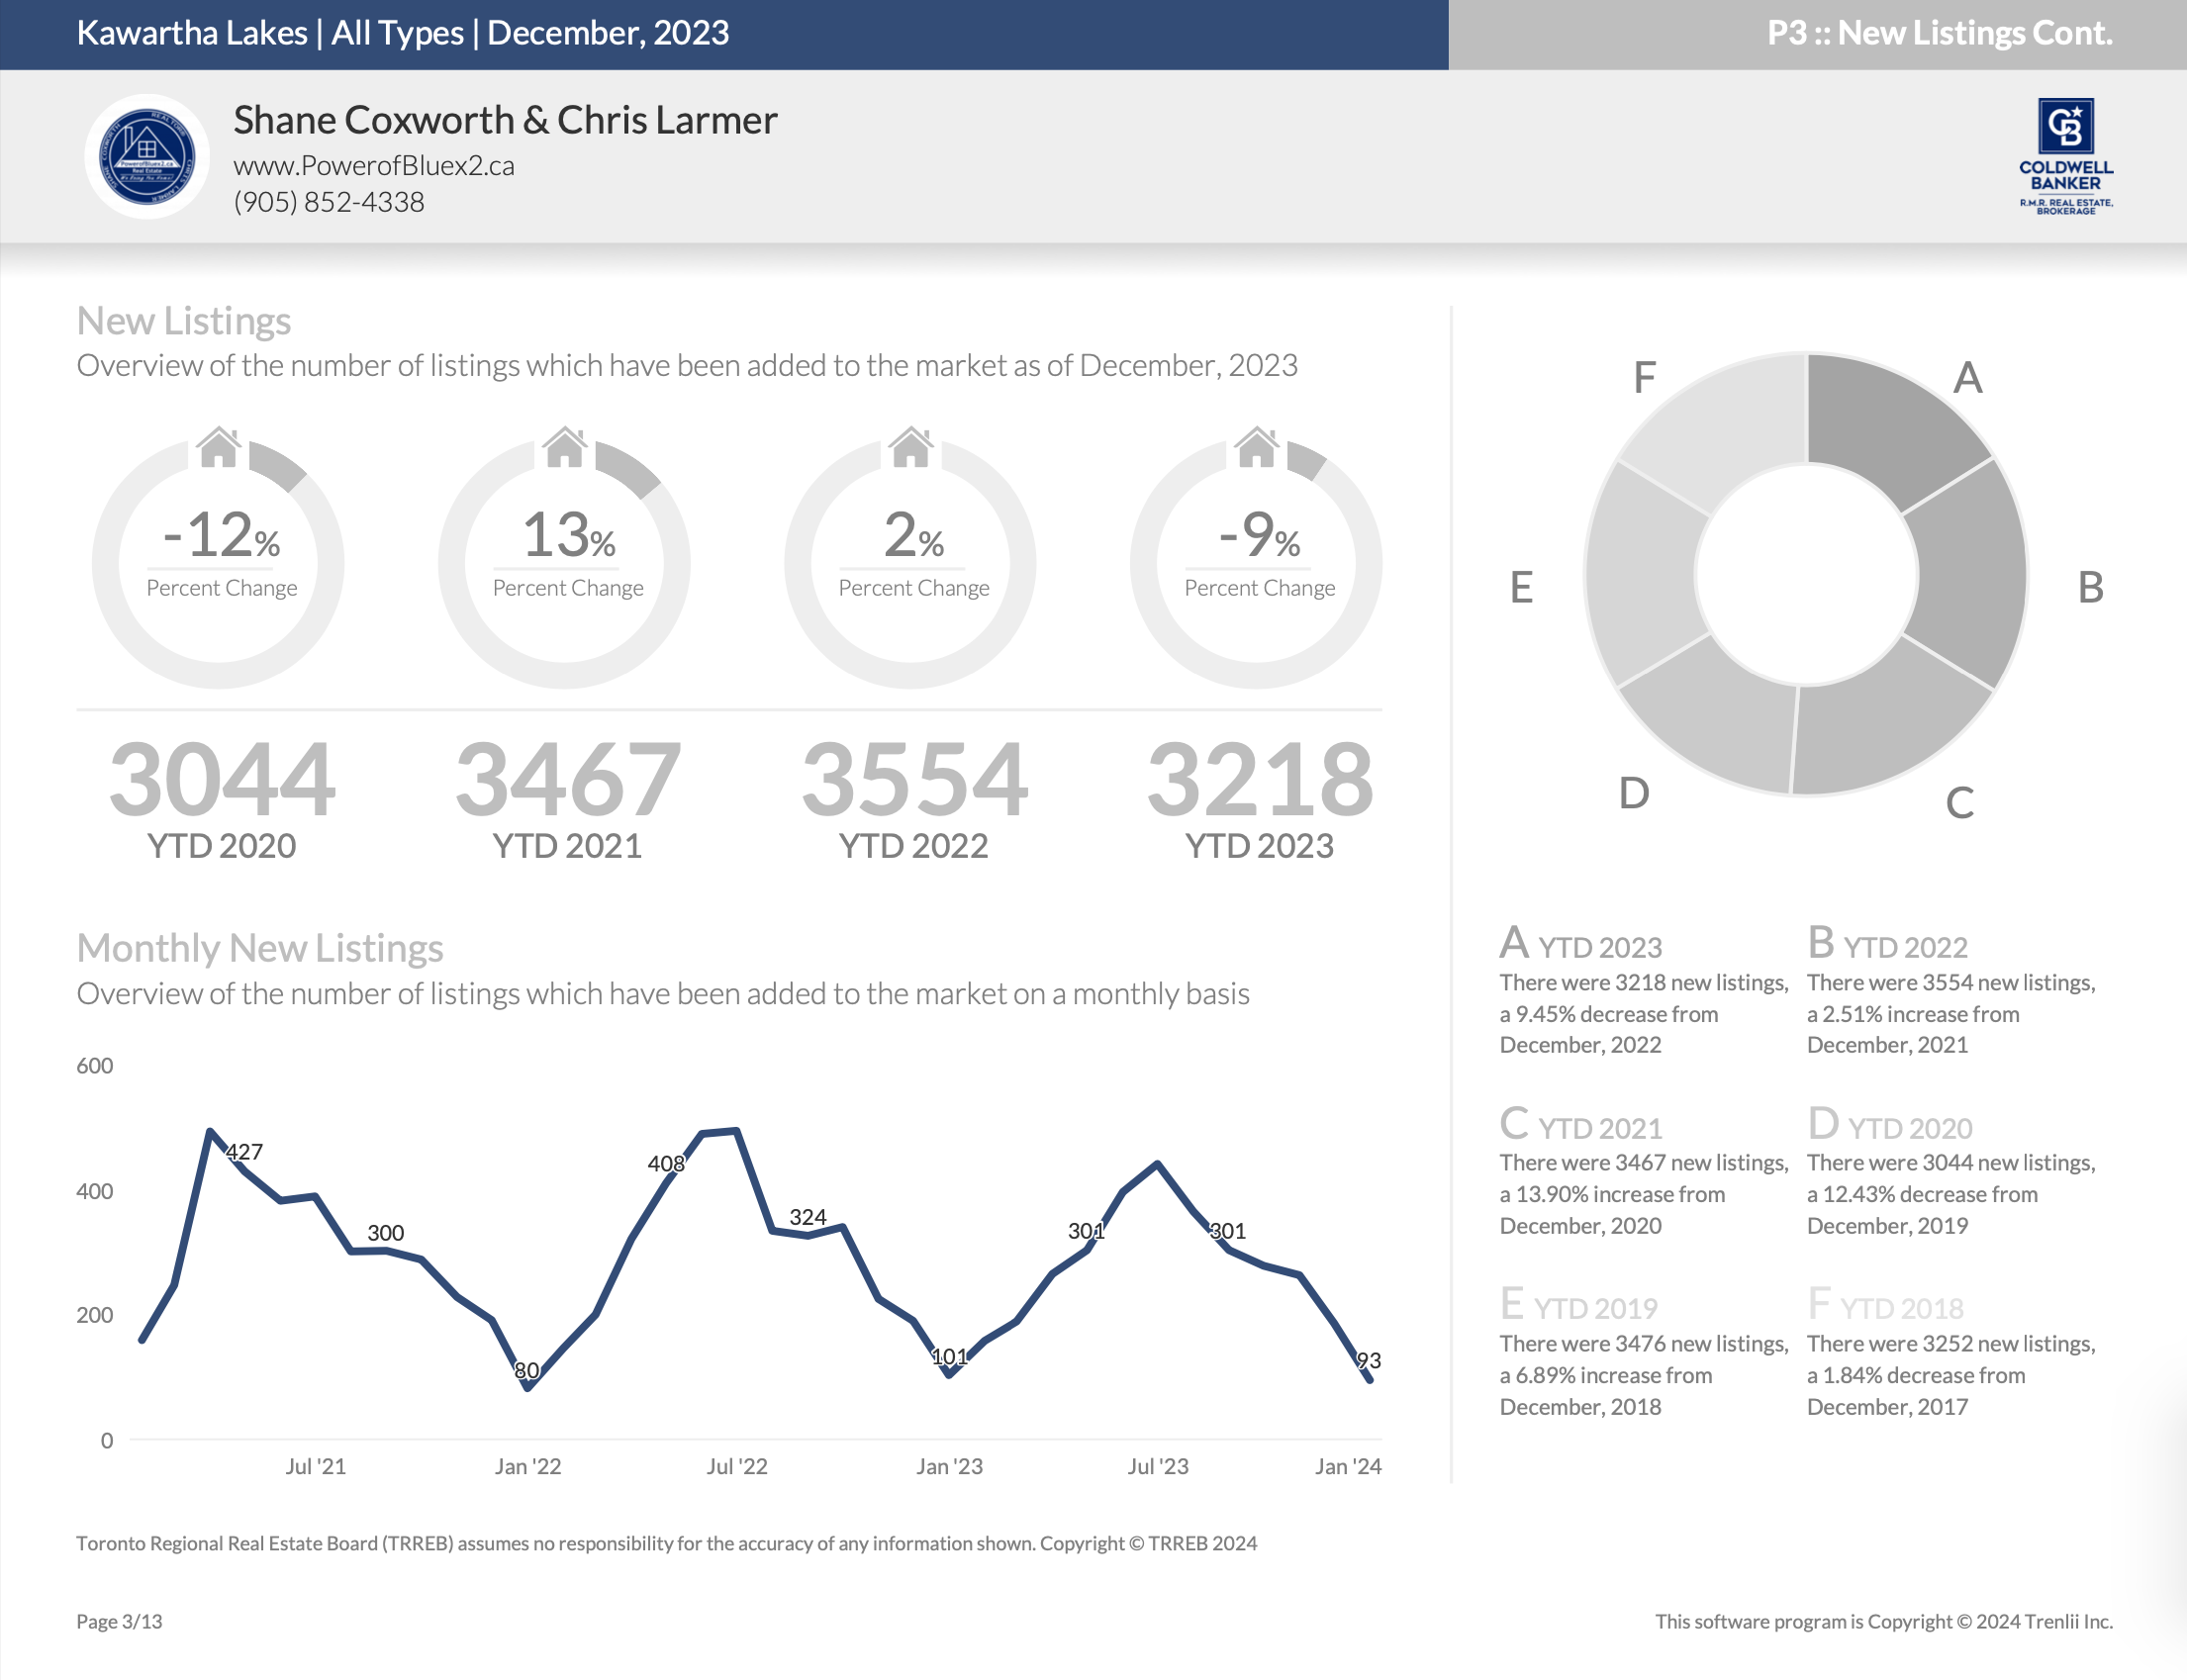
New Listings – Year-To-Date


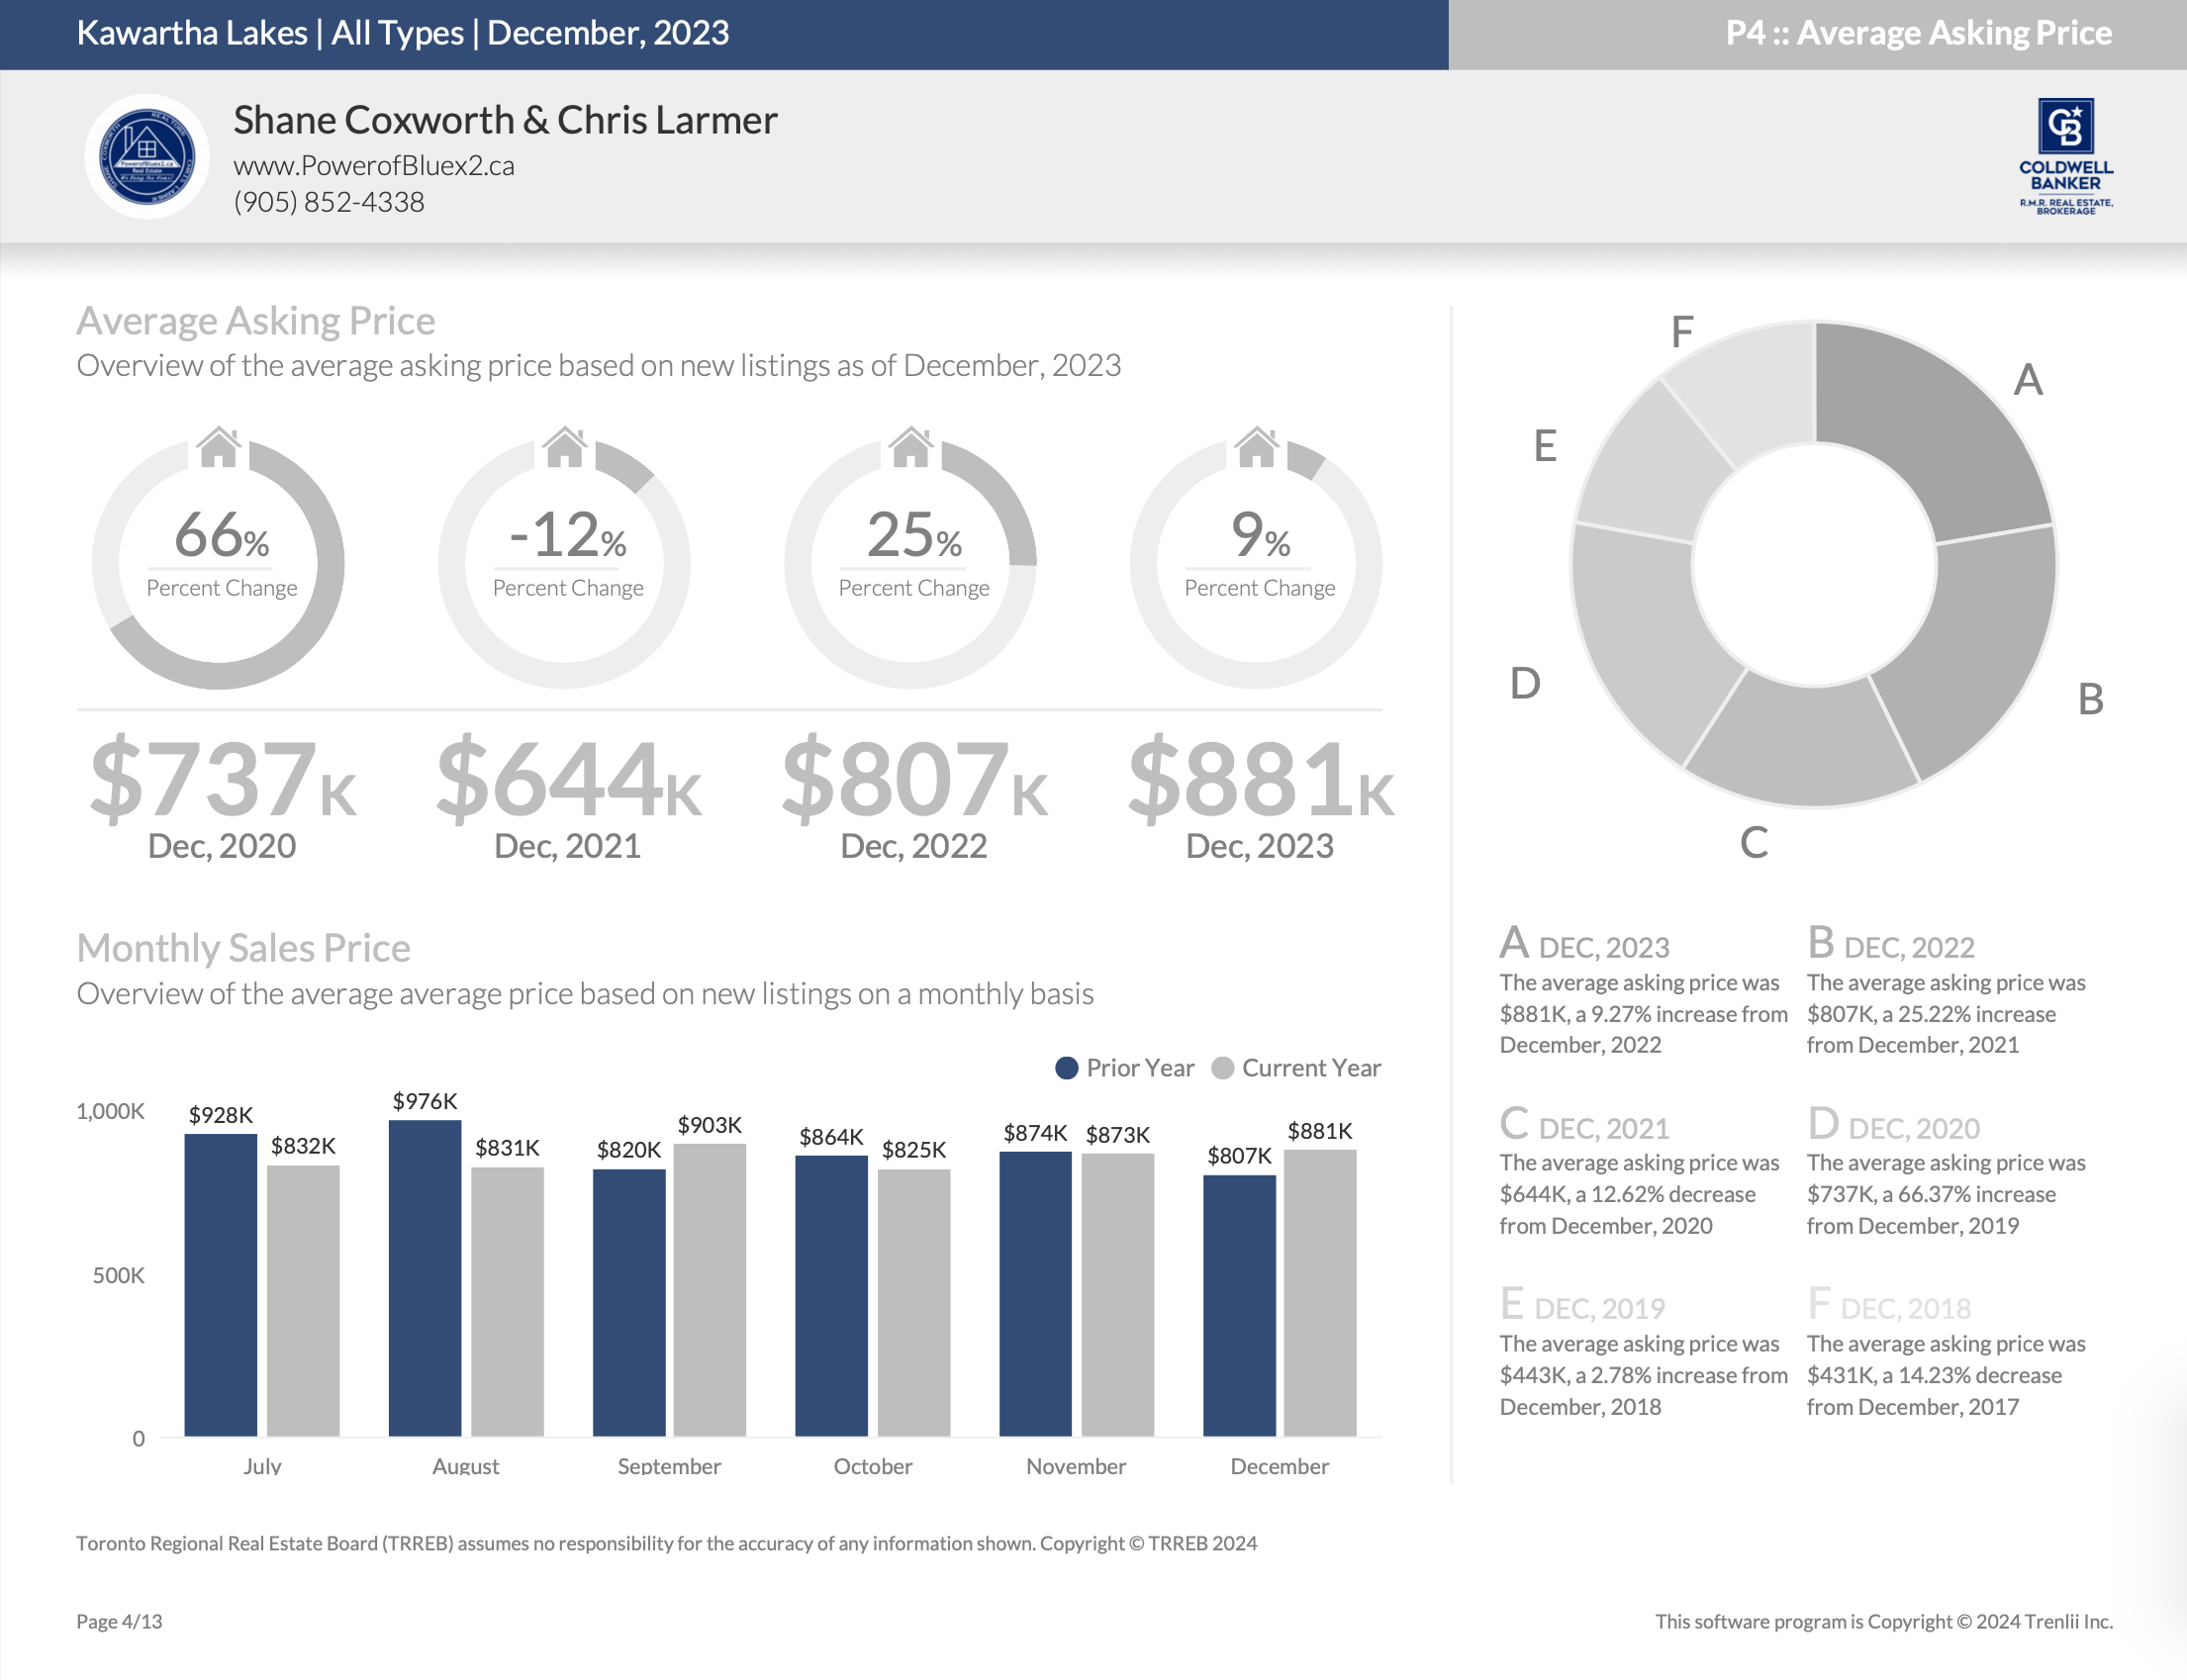
Average Asking Price – November 2023

Kawartha Lakes Housing November 2023


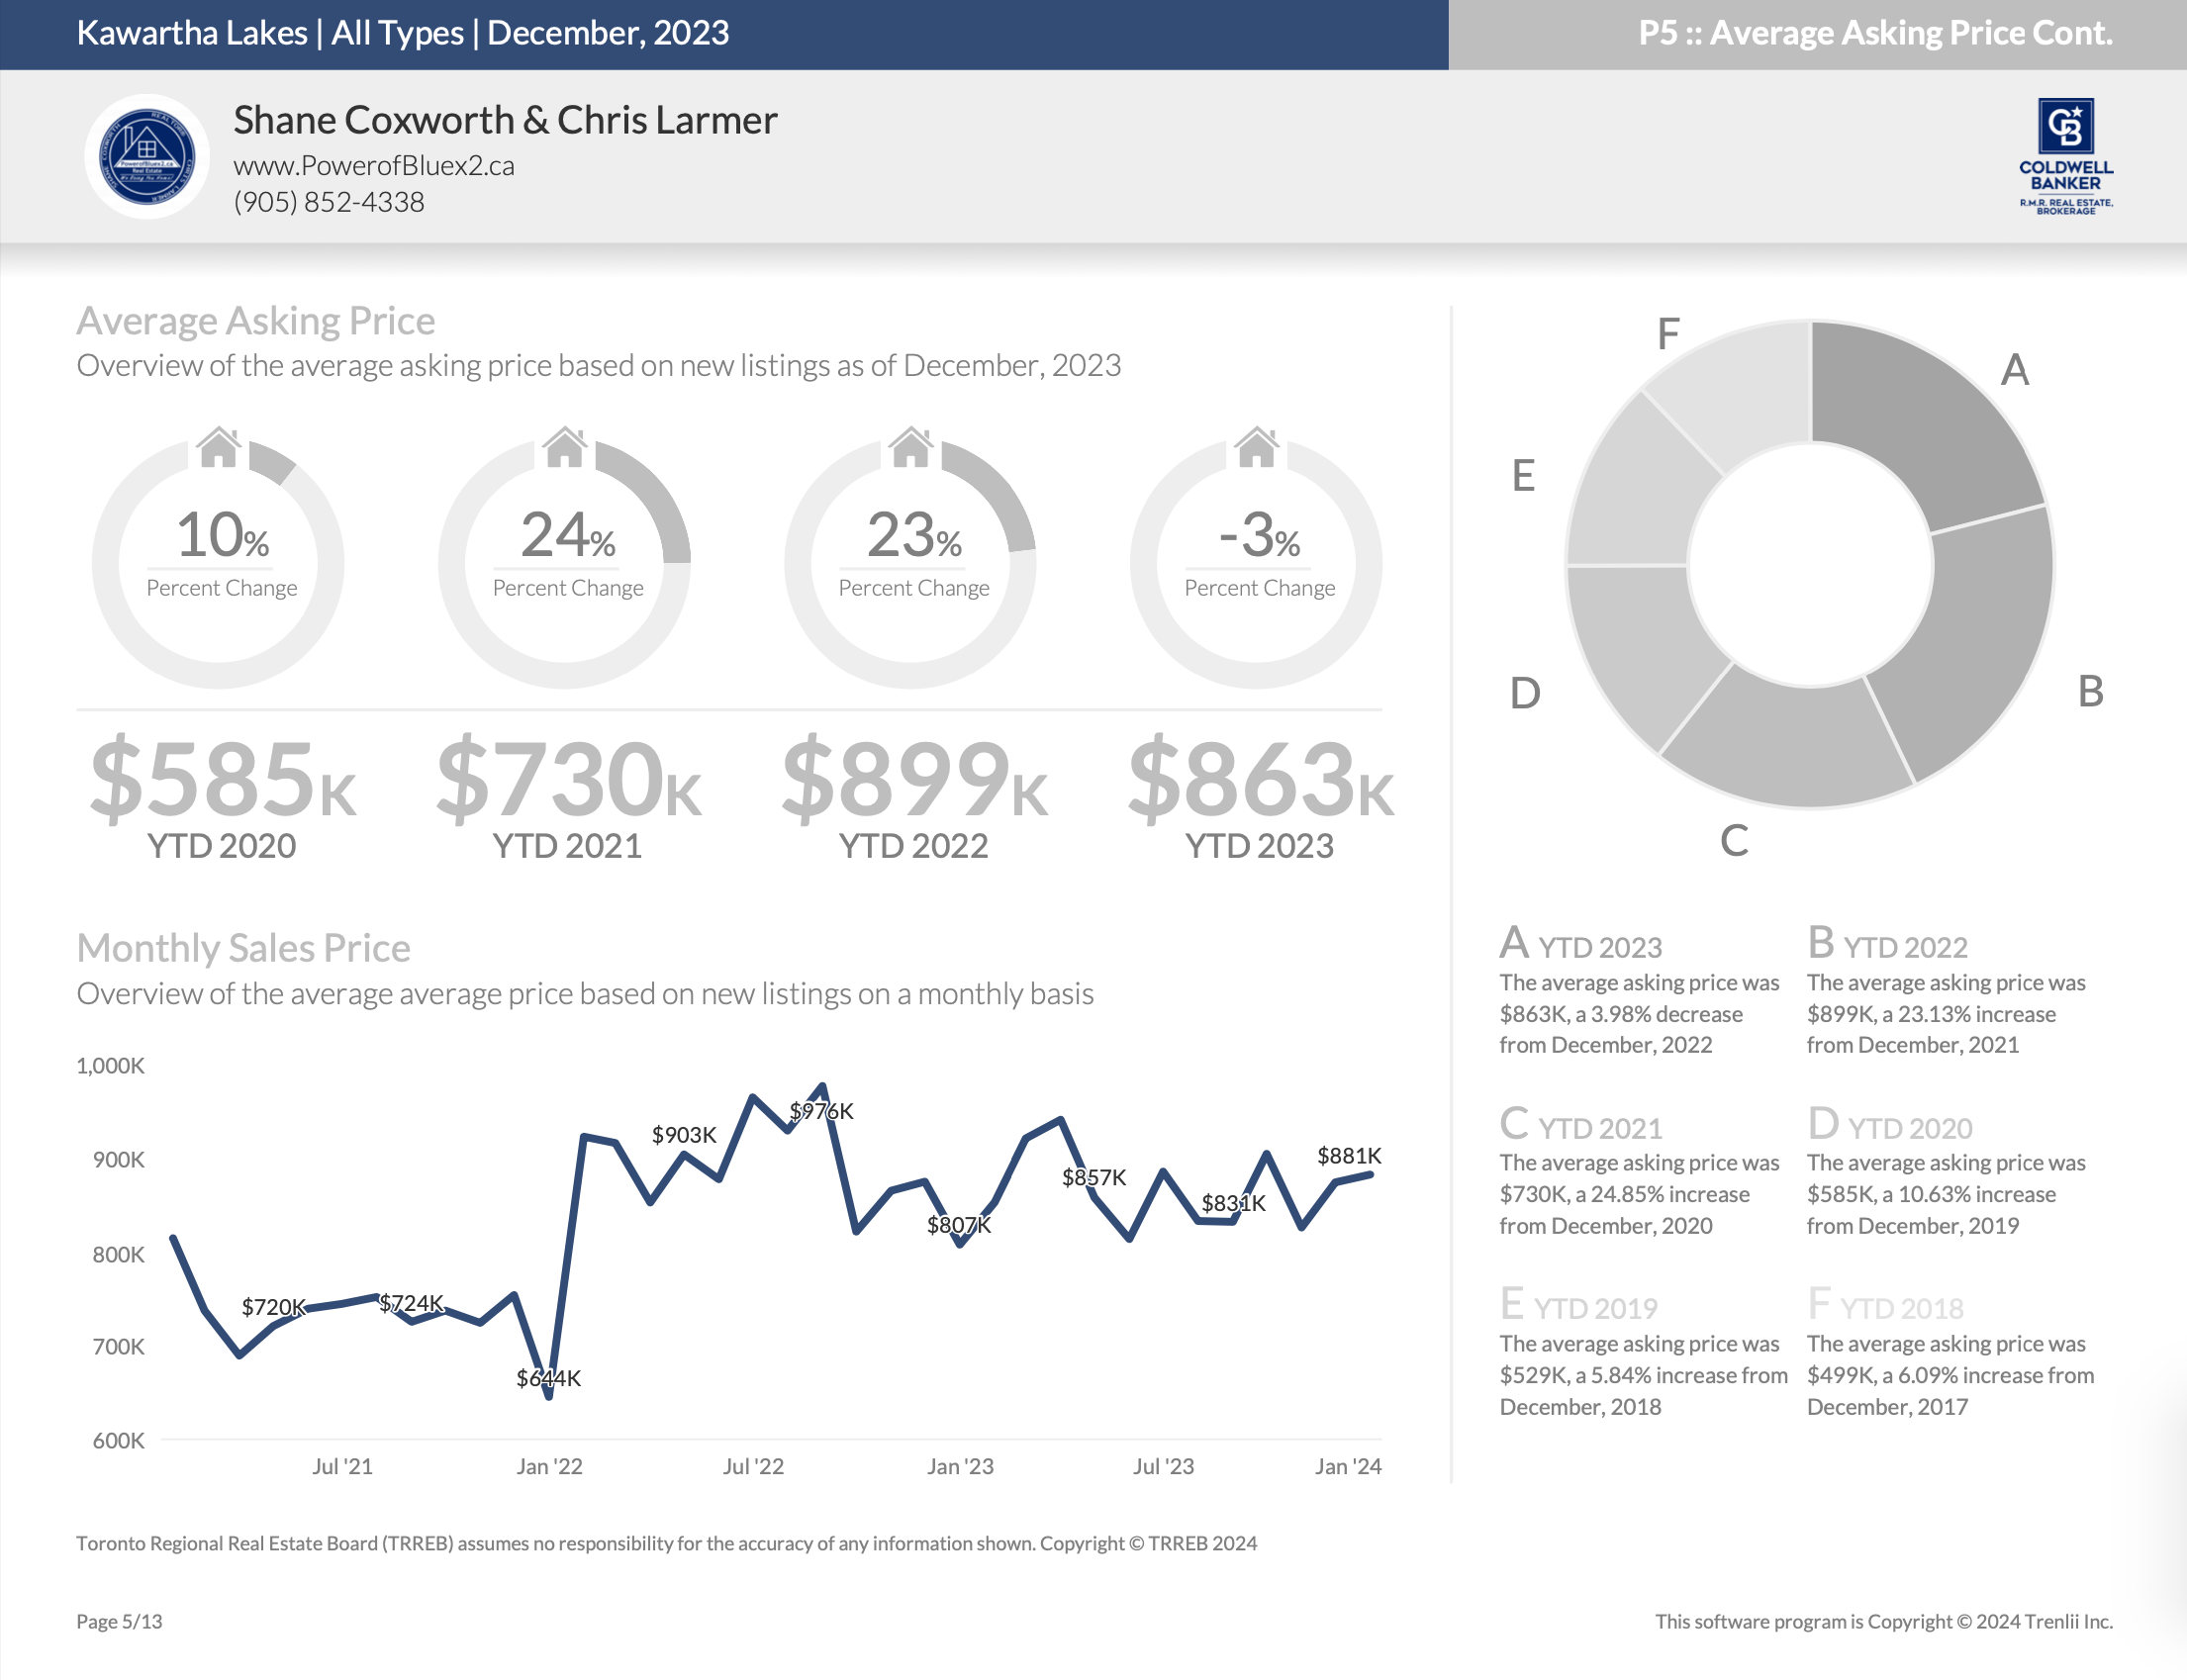
Average Asking Price – Year-to-Date


Number of Properties Sold – November 2023

Kawartha Lakes Housing November 2023


Number of Properties Sold – Year-to-Date


Average Sold Price – November 2023

Kawartha Lakes Housing November 2023


Average Sold Price – Year-to-Date


Days on Market – November 2023

Kawartha Lakes Housing November 2023


Days on Market – Year-to-Date


Average List Price to Sell Price Ratio – November 2023

Kawartha Lakes Housing November 2023


Average List Price to Sell Price Ratio – Year-to-Date


*Information is believed to be accurate at time of posting but is not guaranteed to be correct 

Not intended as a solicitation if your property is already listed by another broker. Affiliated real estate agents are independent contractor sales associates, not employees. ©2021 Coldwell Banker. All Rights Reserved. Coldwell Banker and the Coldwell Banker logos are trademarks of Coldwell Banker Real Estate LLC. The Coldwell Banker® System is comprised of company owned offices which are owned by a subsidiary of Realogy Brokerage Group LLC and franchised offices which are independently owned and operated. The Coldwell Banker System fully supports the principles of the Fair Housing Act and the Equal Opportunity Act.


Click below for more reports

Durham Region

Township of Uxbridge

Township of Scugog

Township Brock


Neighbour News

Real Estate Stats December 7, 2023

Uxbridge Housing November 2023

Uxbridge Housing November 2023

Housing Market Report for November 2023

Here is the Township of Uxbridge  Housing November 2023 report (all housing types), with reports from the Toronto Regional Real Estate Board and the Central Lakes Association of REALTORS®  included.

This housing report for Township of Uxbridge includes the number of new listings, average list price, number of properties sold, average selling price, average days on market and average asking price to selling price ratio for all property types within the Township of Uxbridge.


Scroll to the bottom for links to take you to the housing market reports for Durham, Scugog, Brock and the Kawartha Lakes.


CREA HOUSING MARKET REPORT – NOVEMBER 2023


From Toronto Regional Real Estate Board


Toronto Regional Real Estate Board – Market Stats At A Glance – November 2023


Read the Toronto Regional Real Estate Board  Market Watch Report 


Durham REALTORS® Report November 2023 Housing Statistics


Read the Durham Association of REALTORS® FULL Real Estate Report


Township of Uxbridge Full Report


*Some values may vary slightly based on the exact date and time the reports were generated.


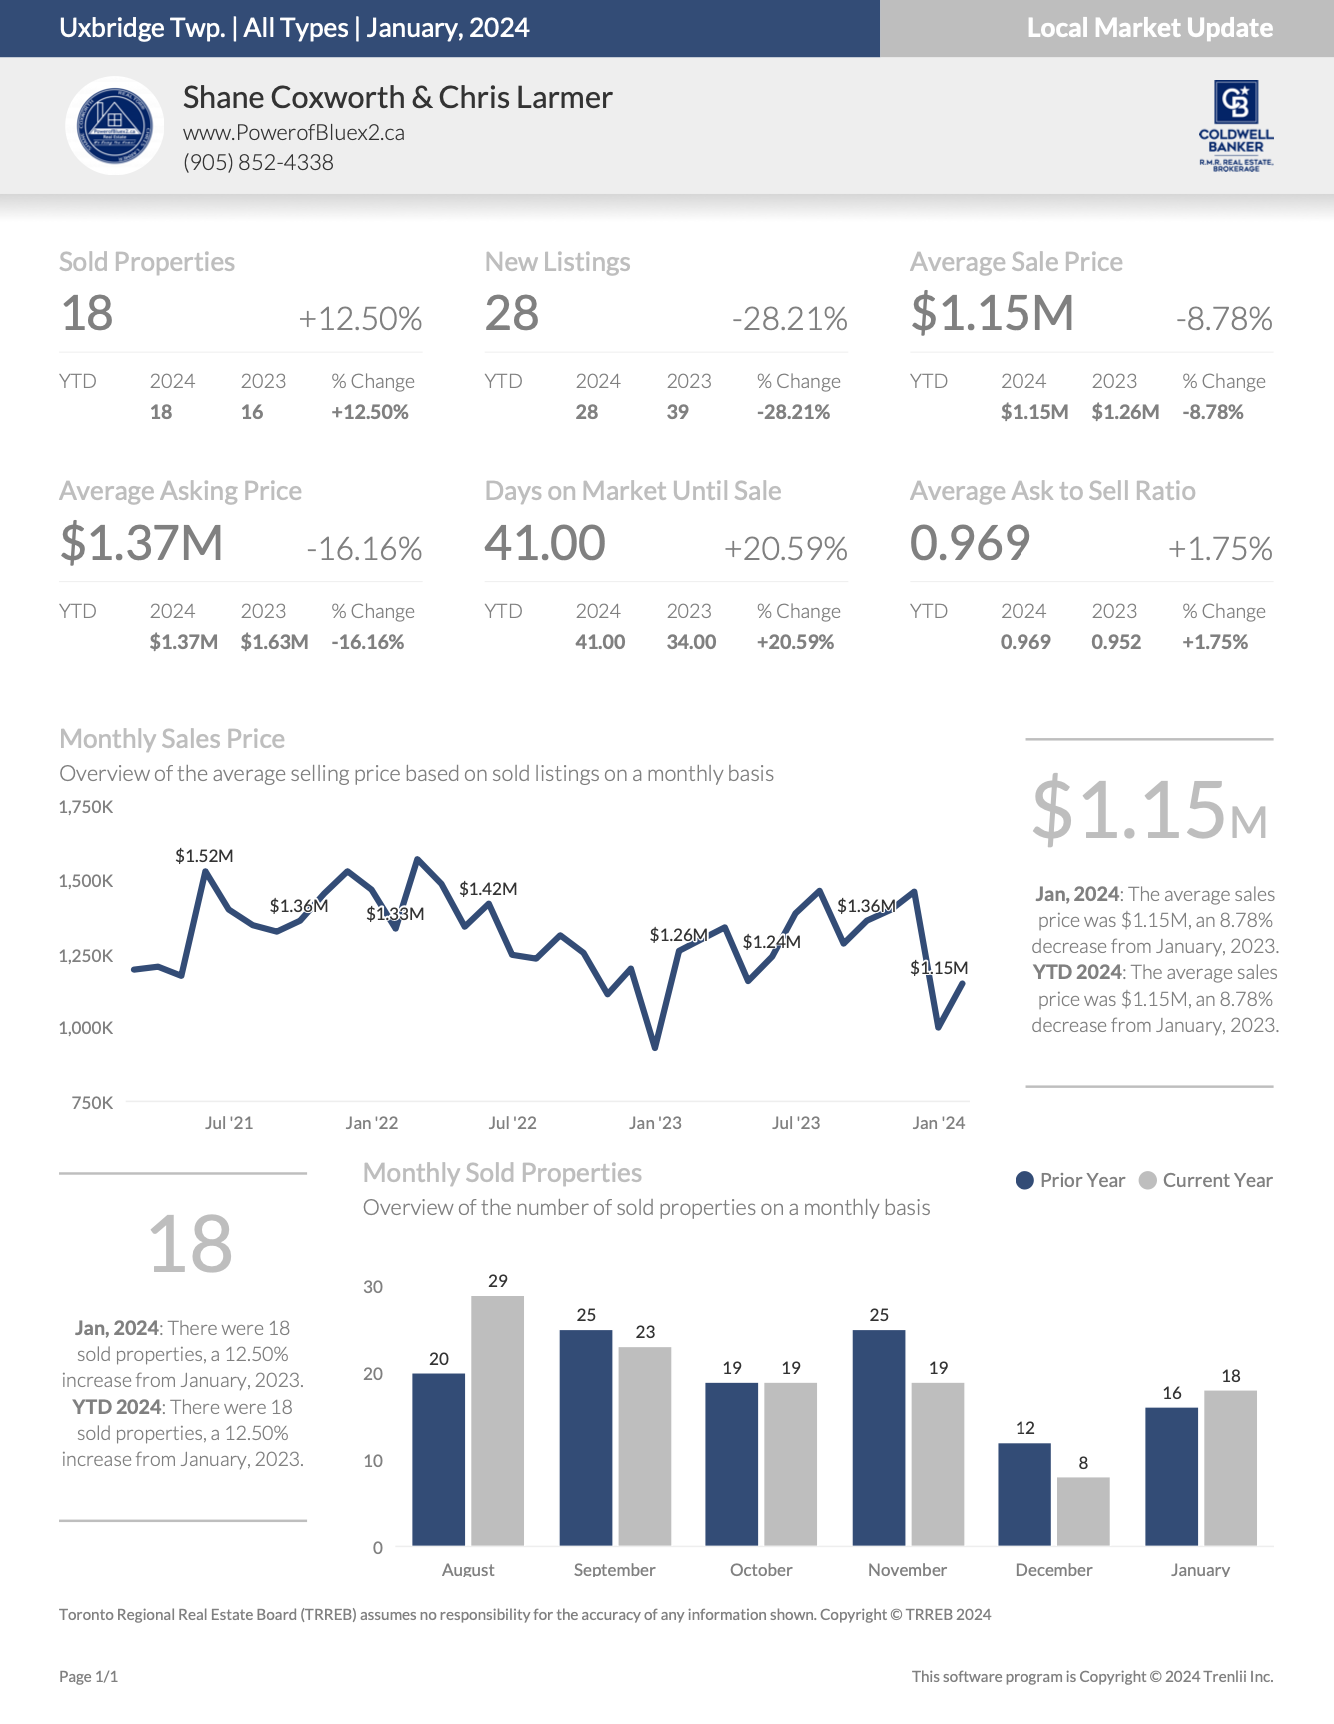
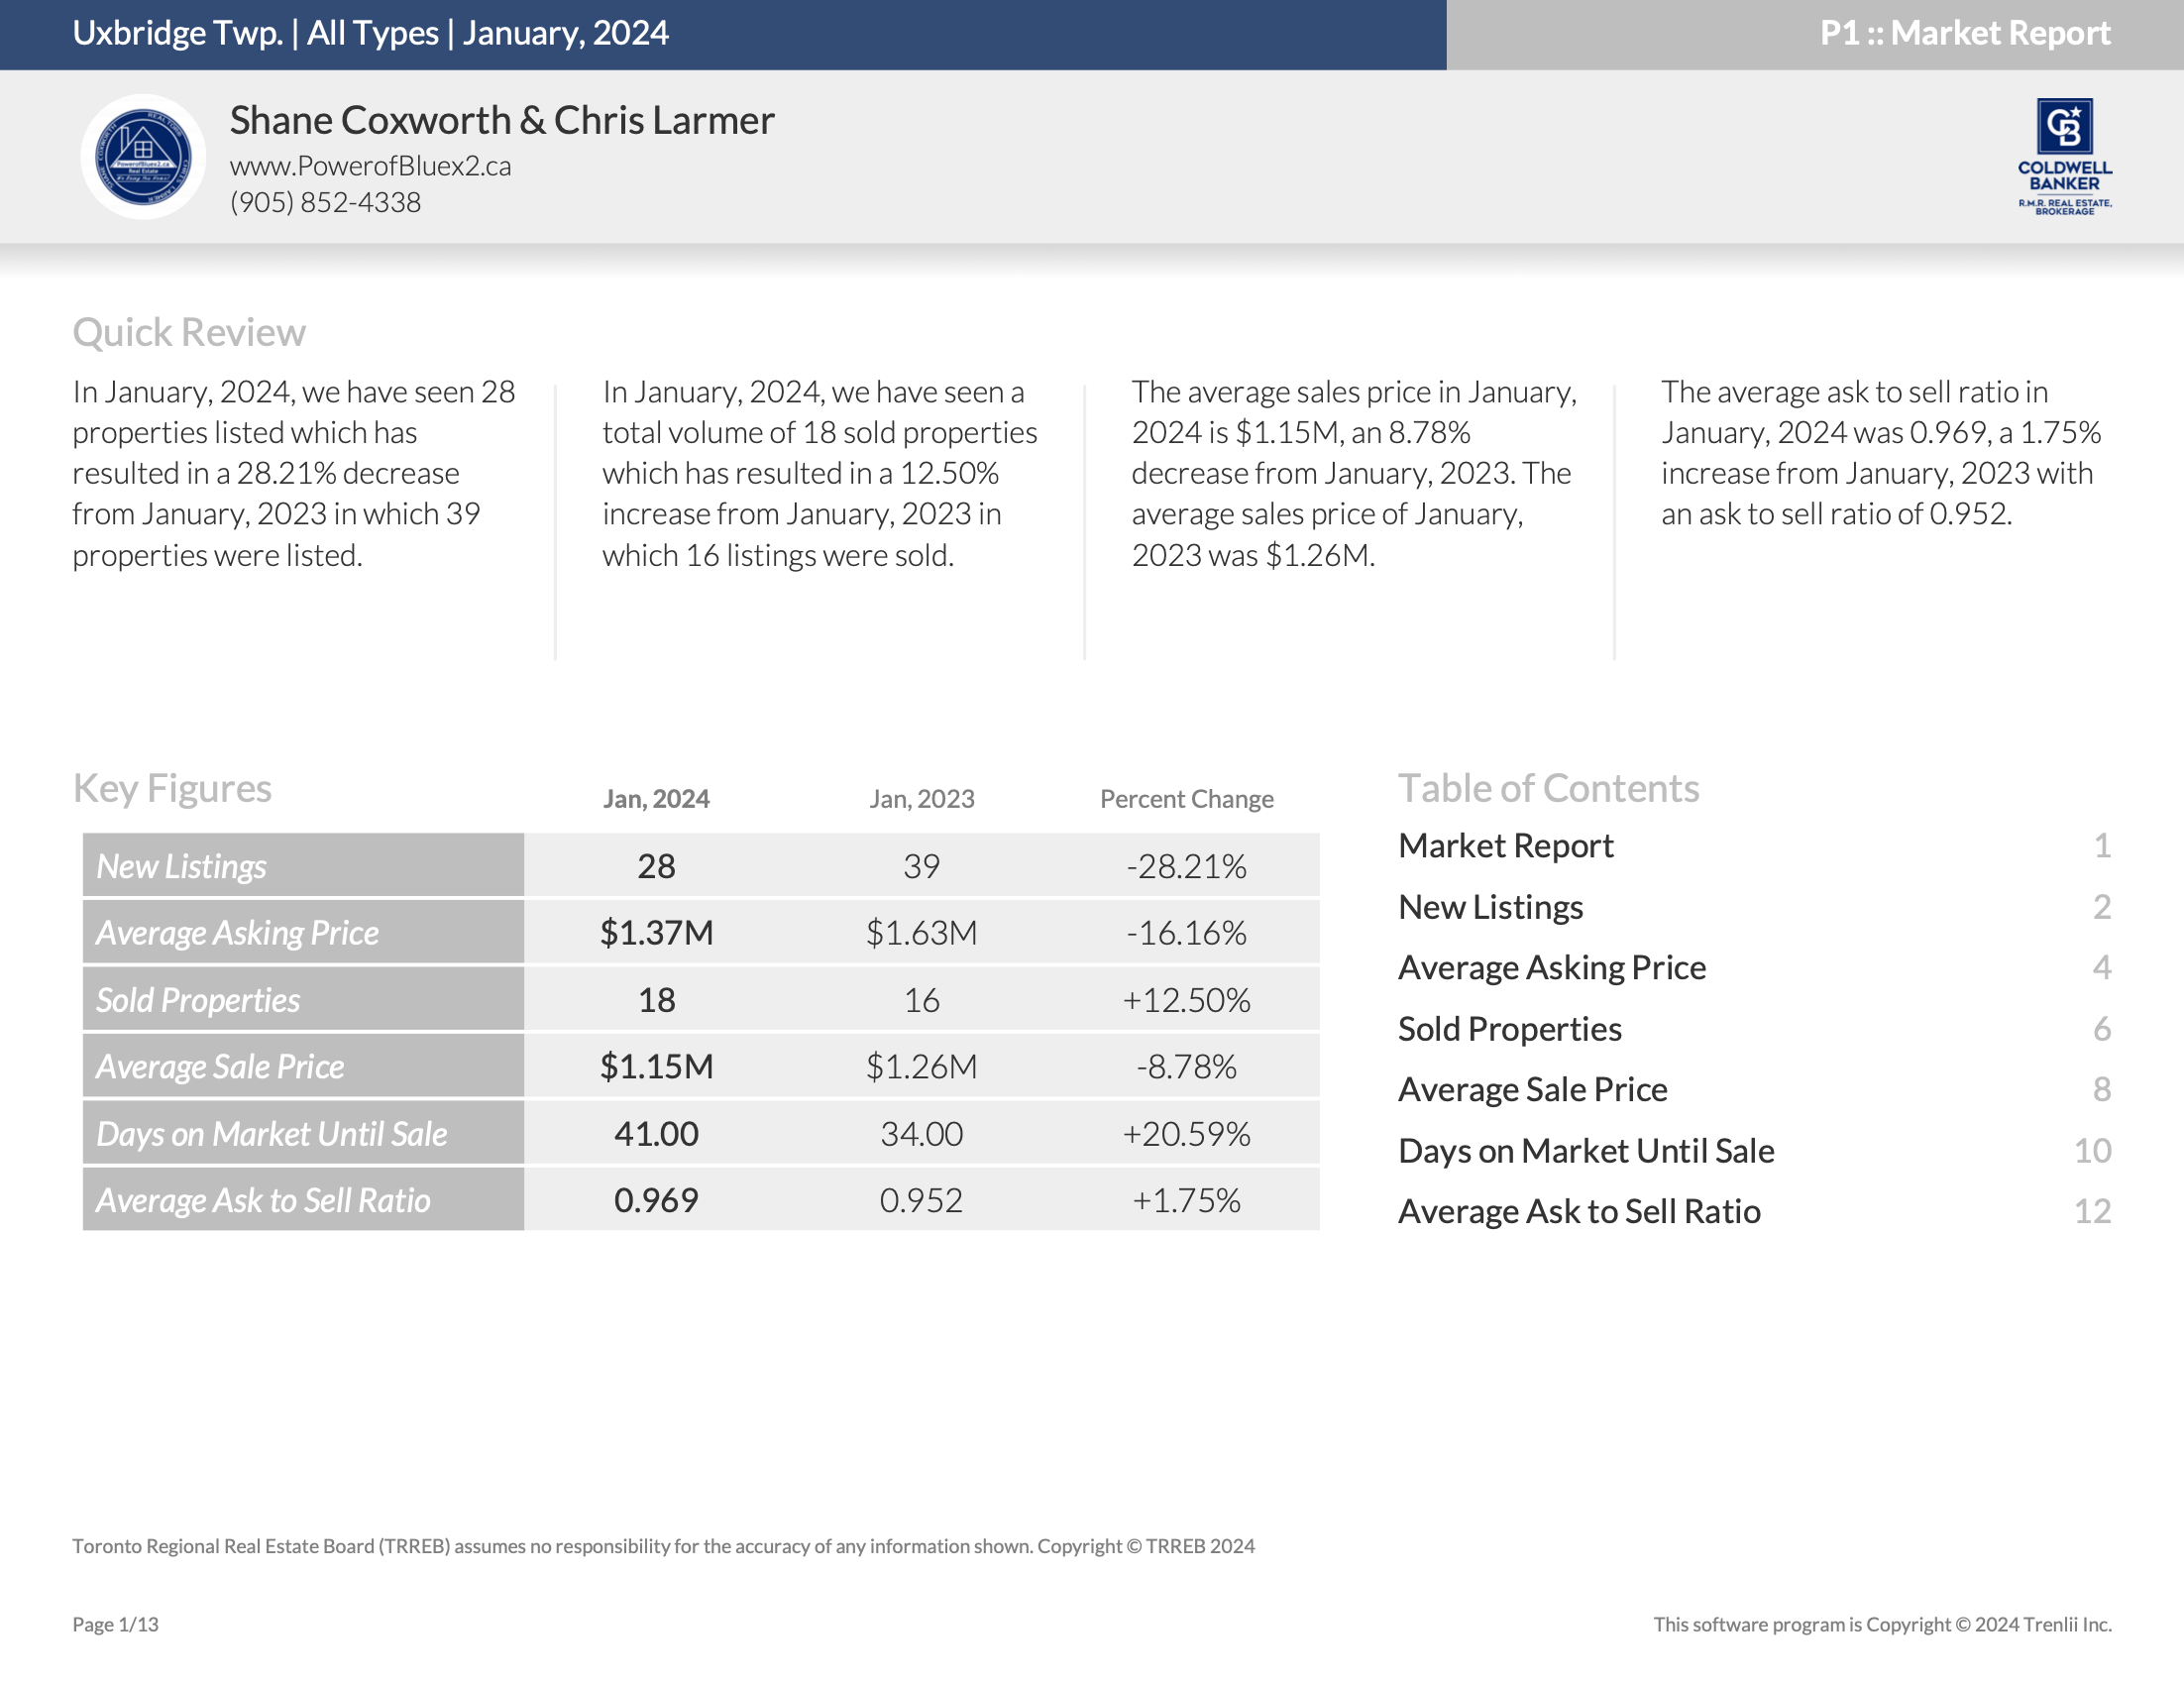
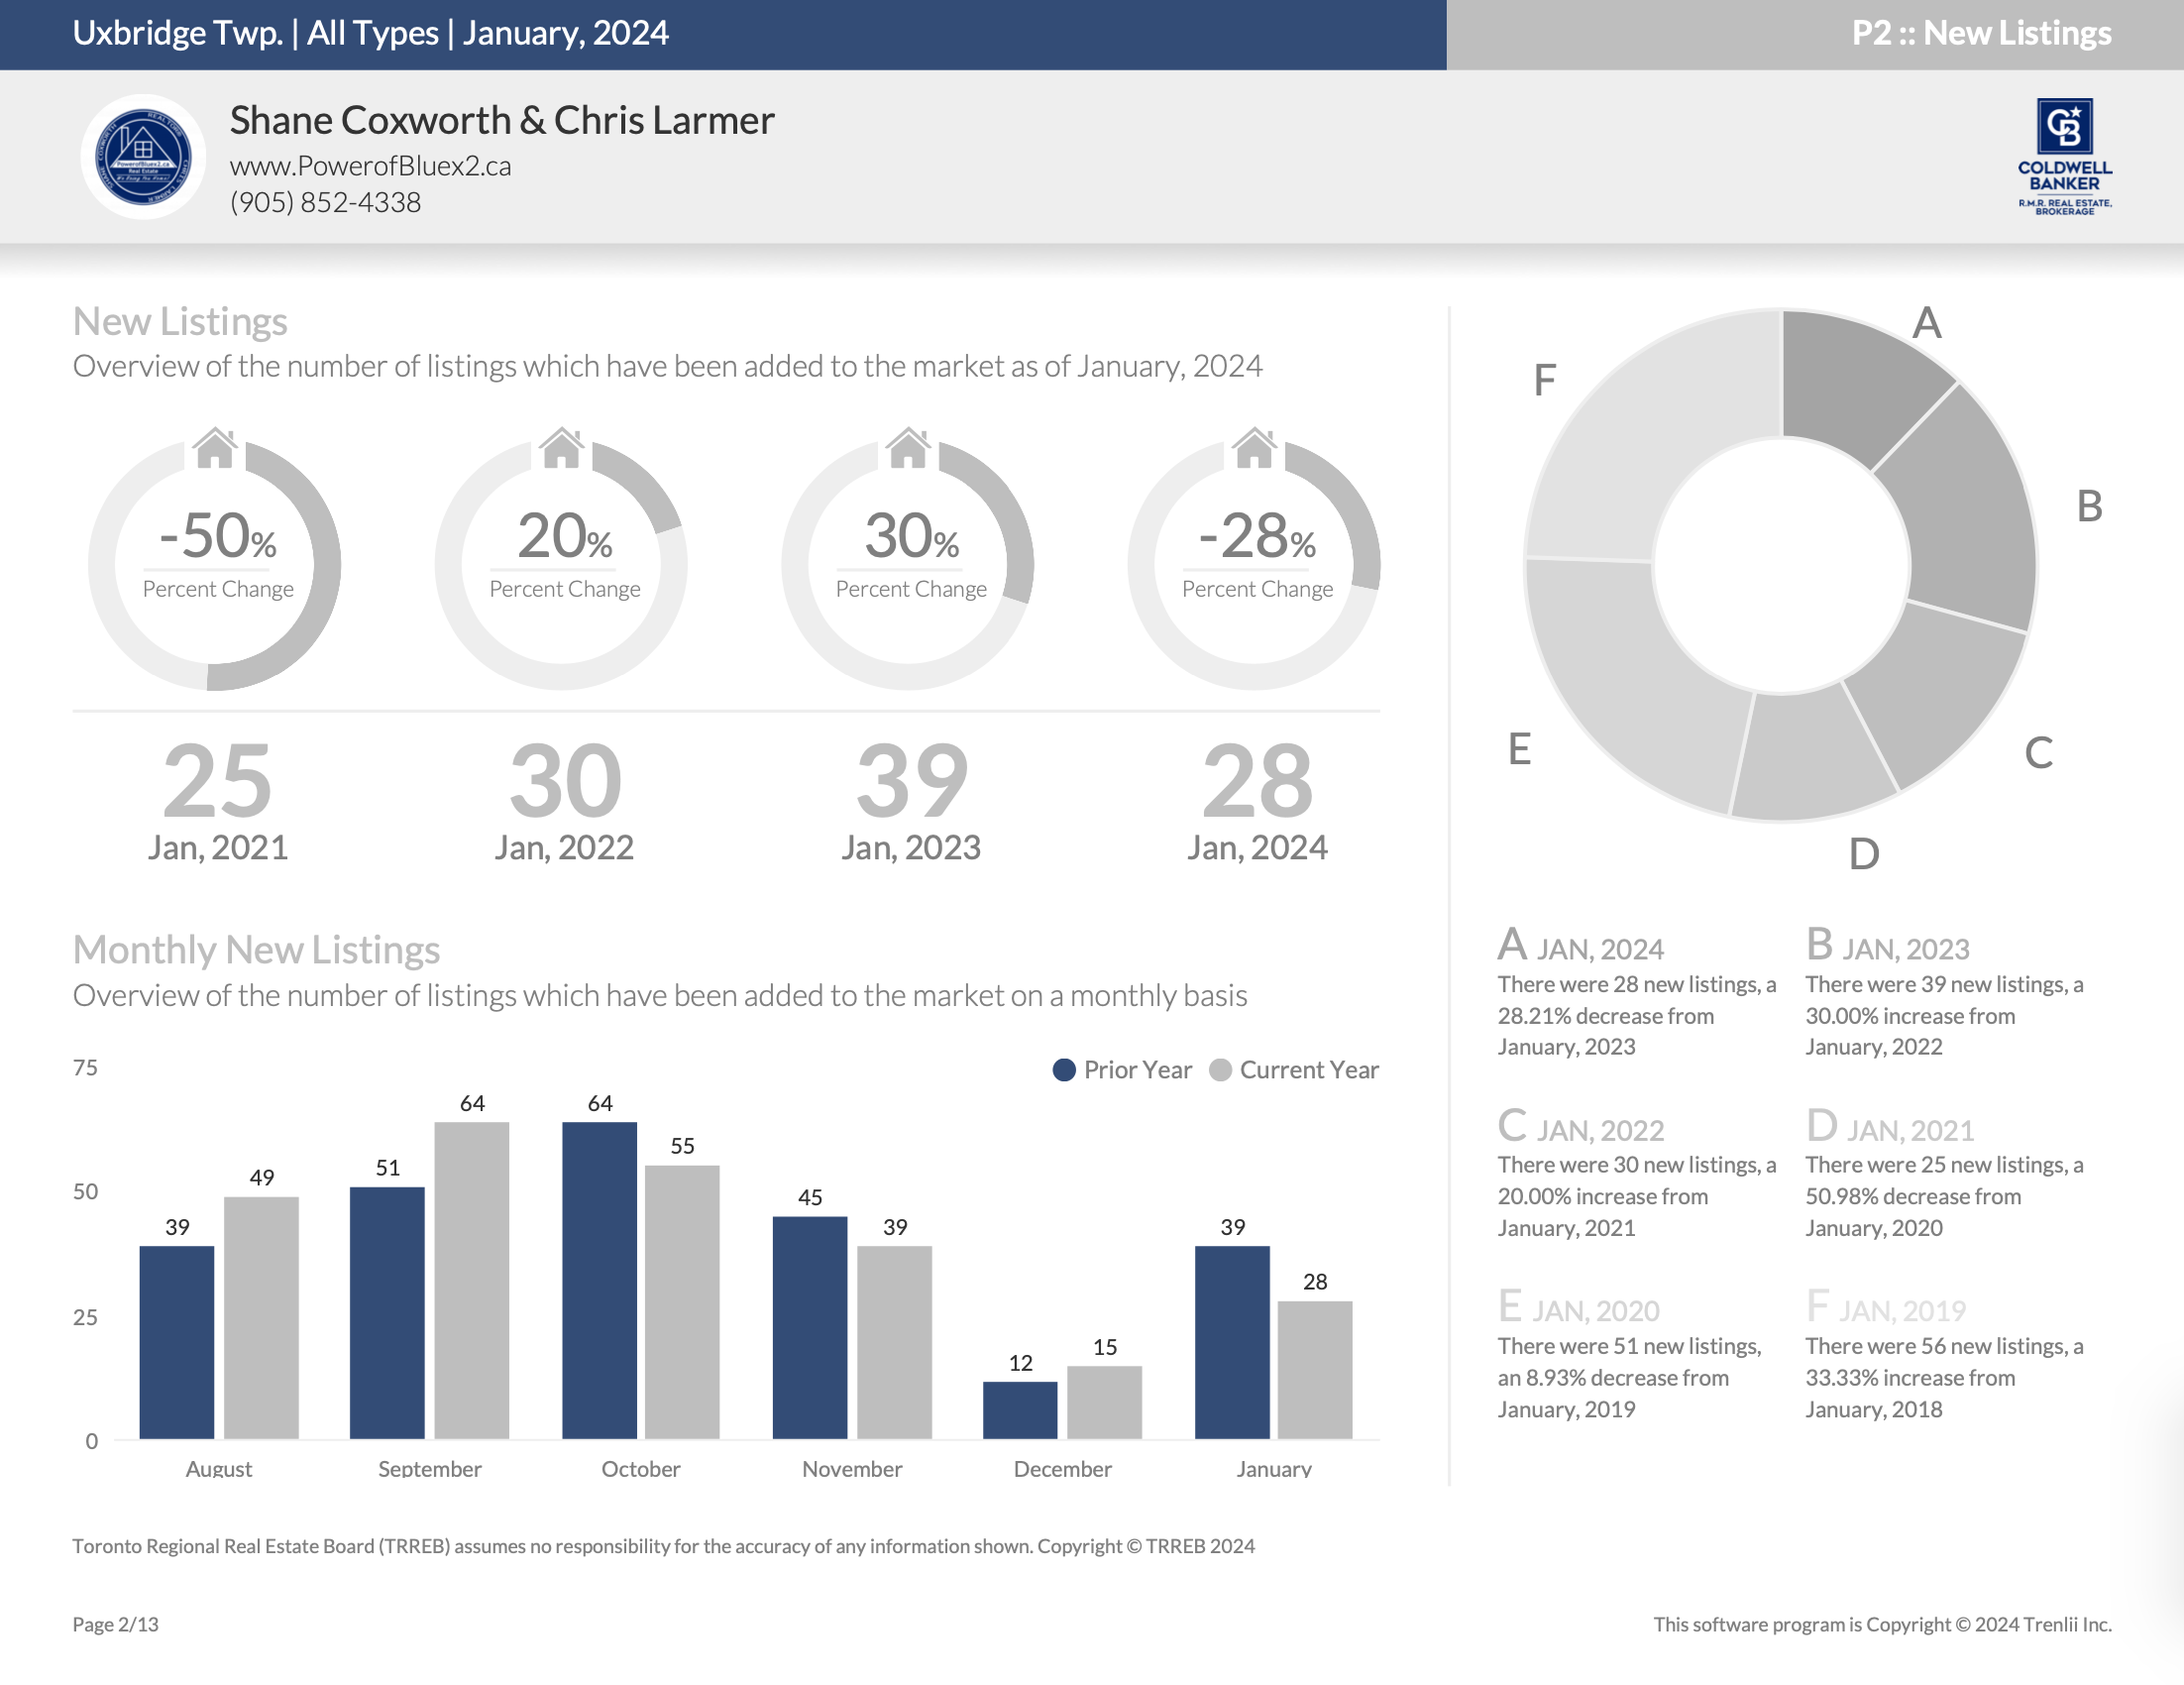
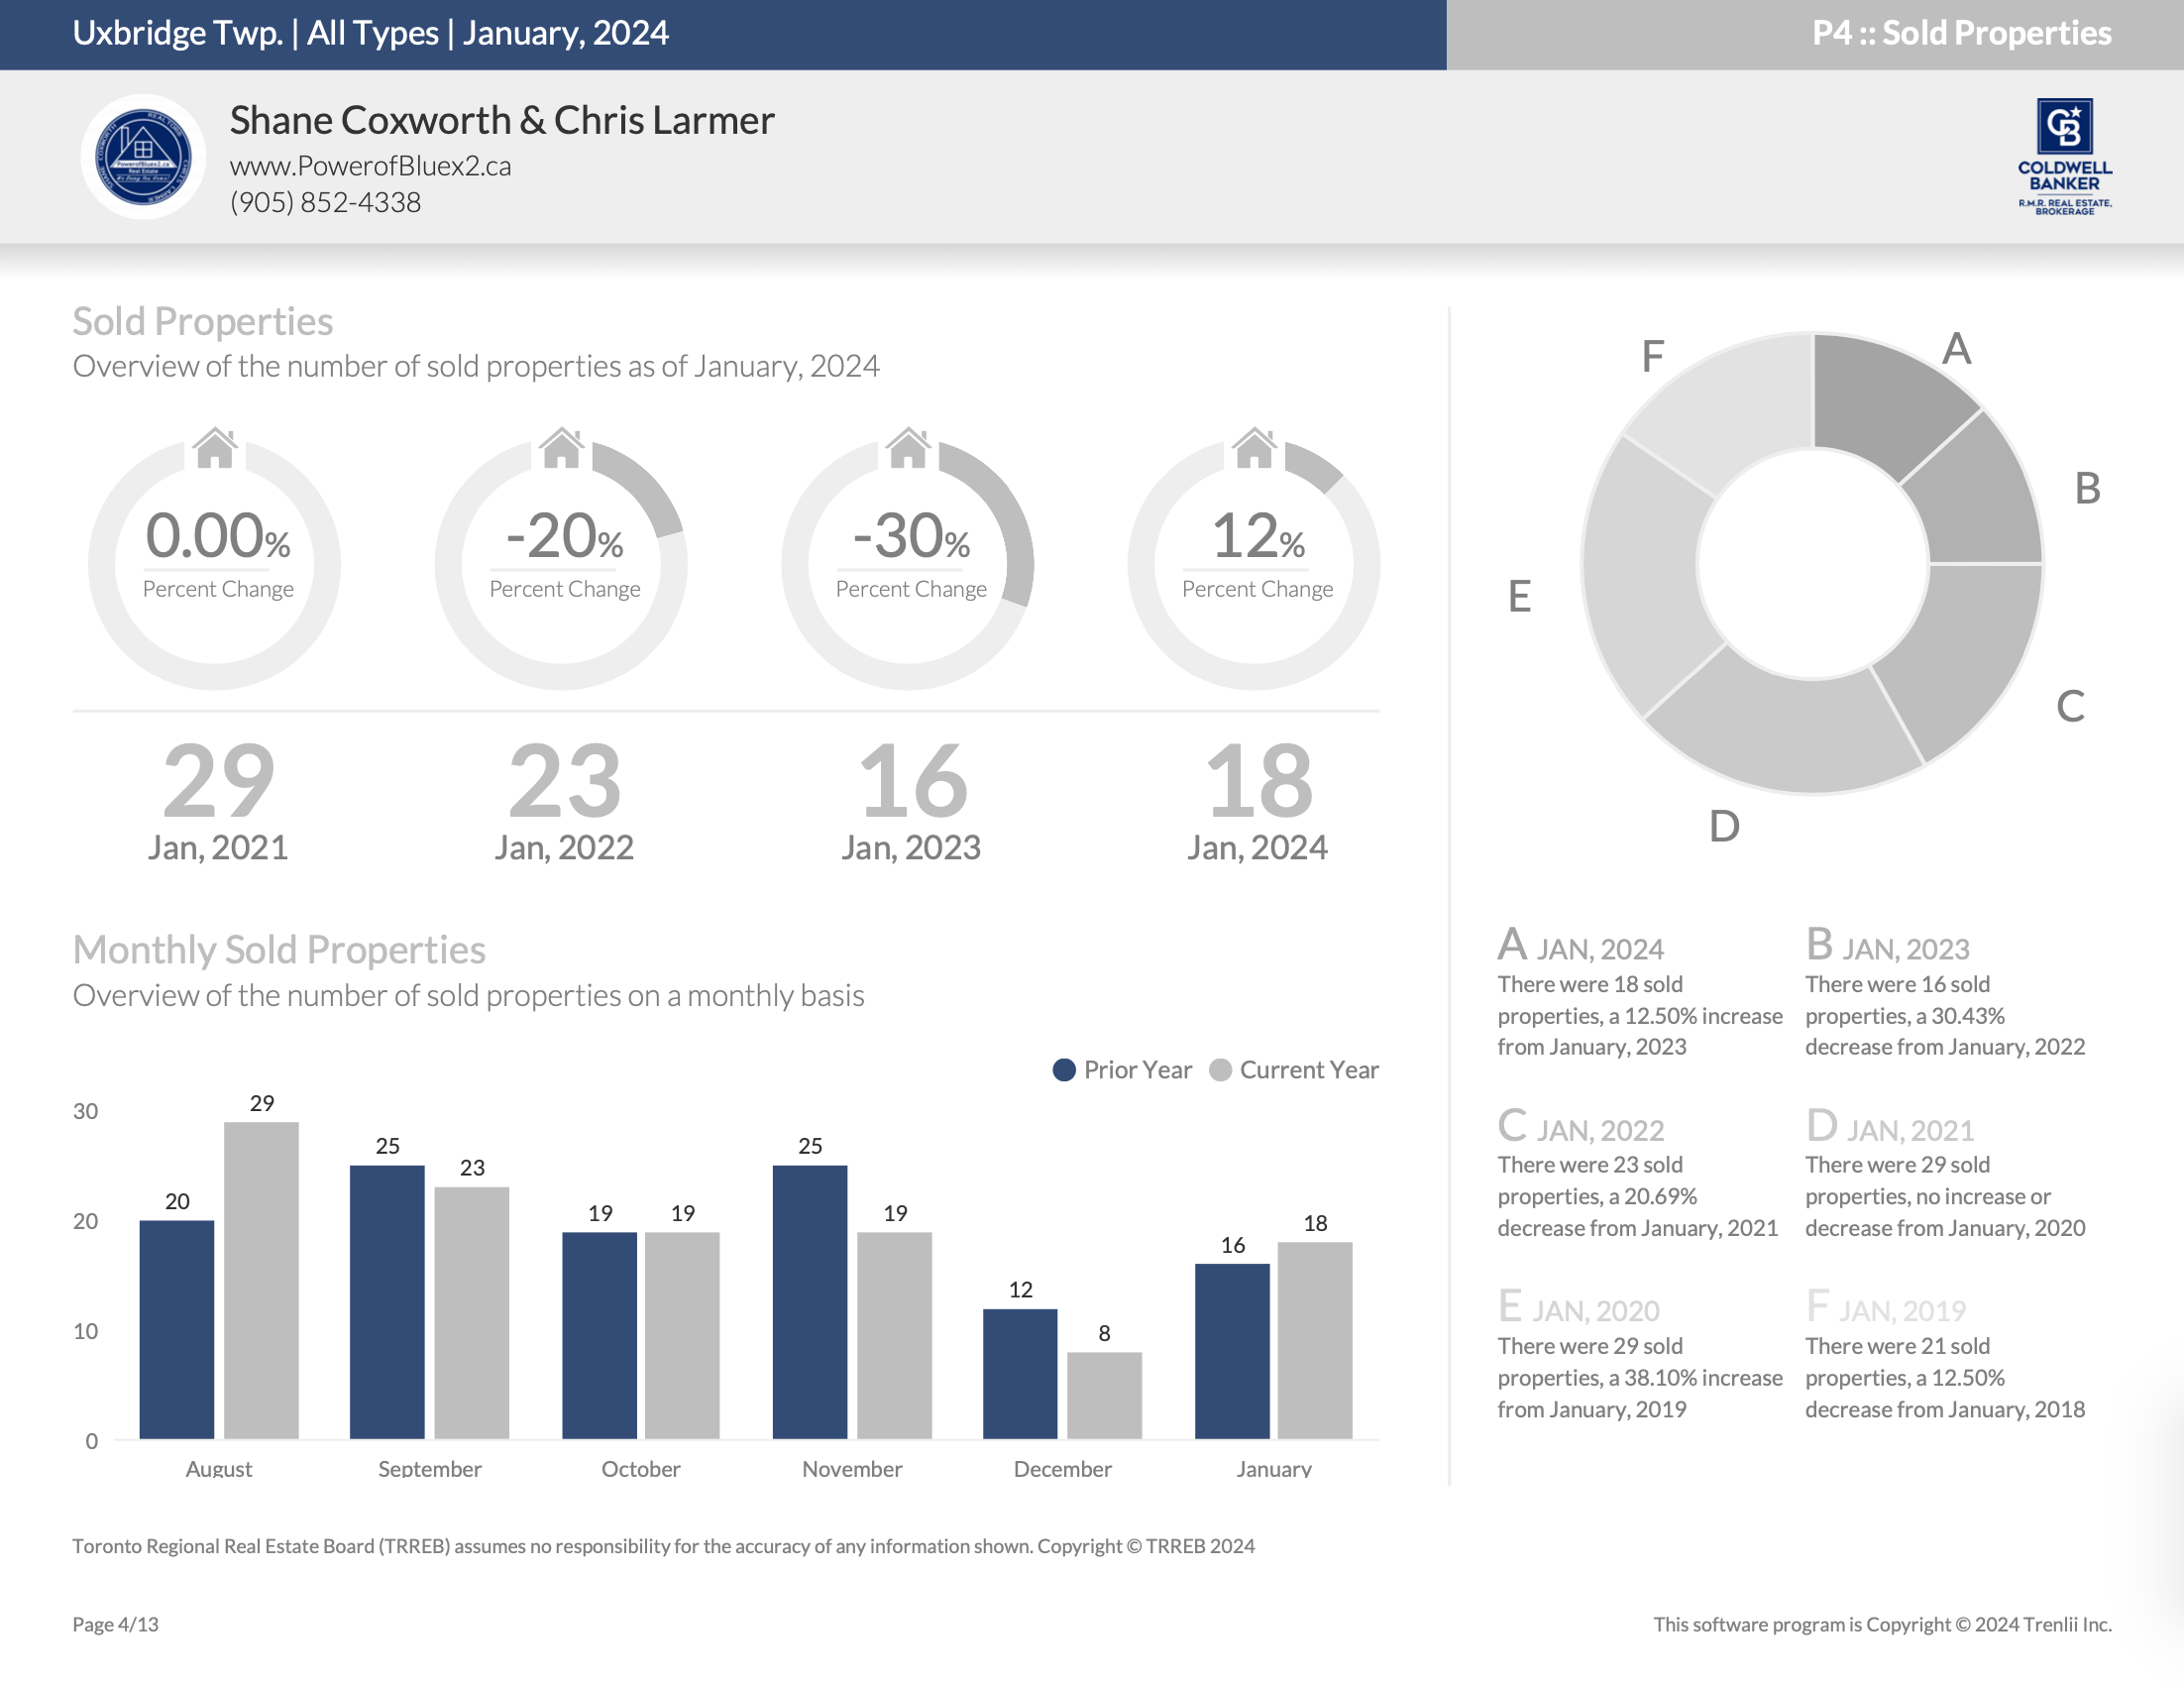
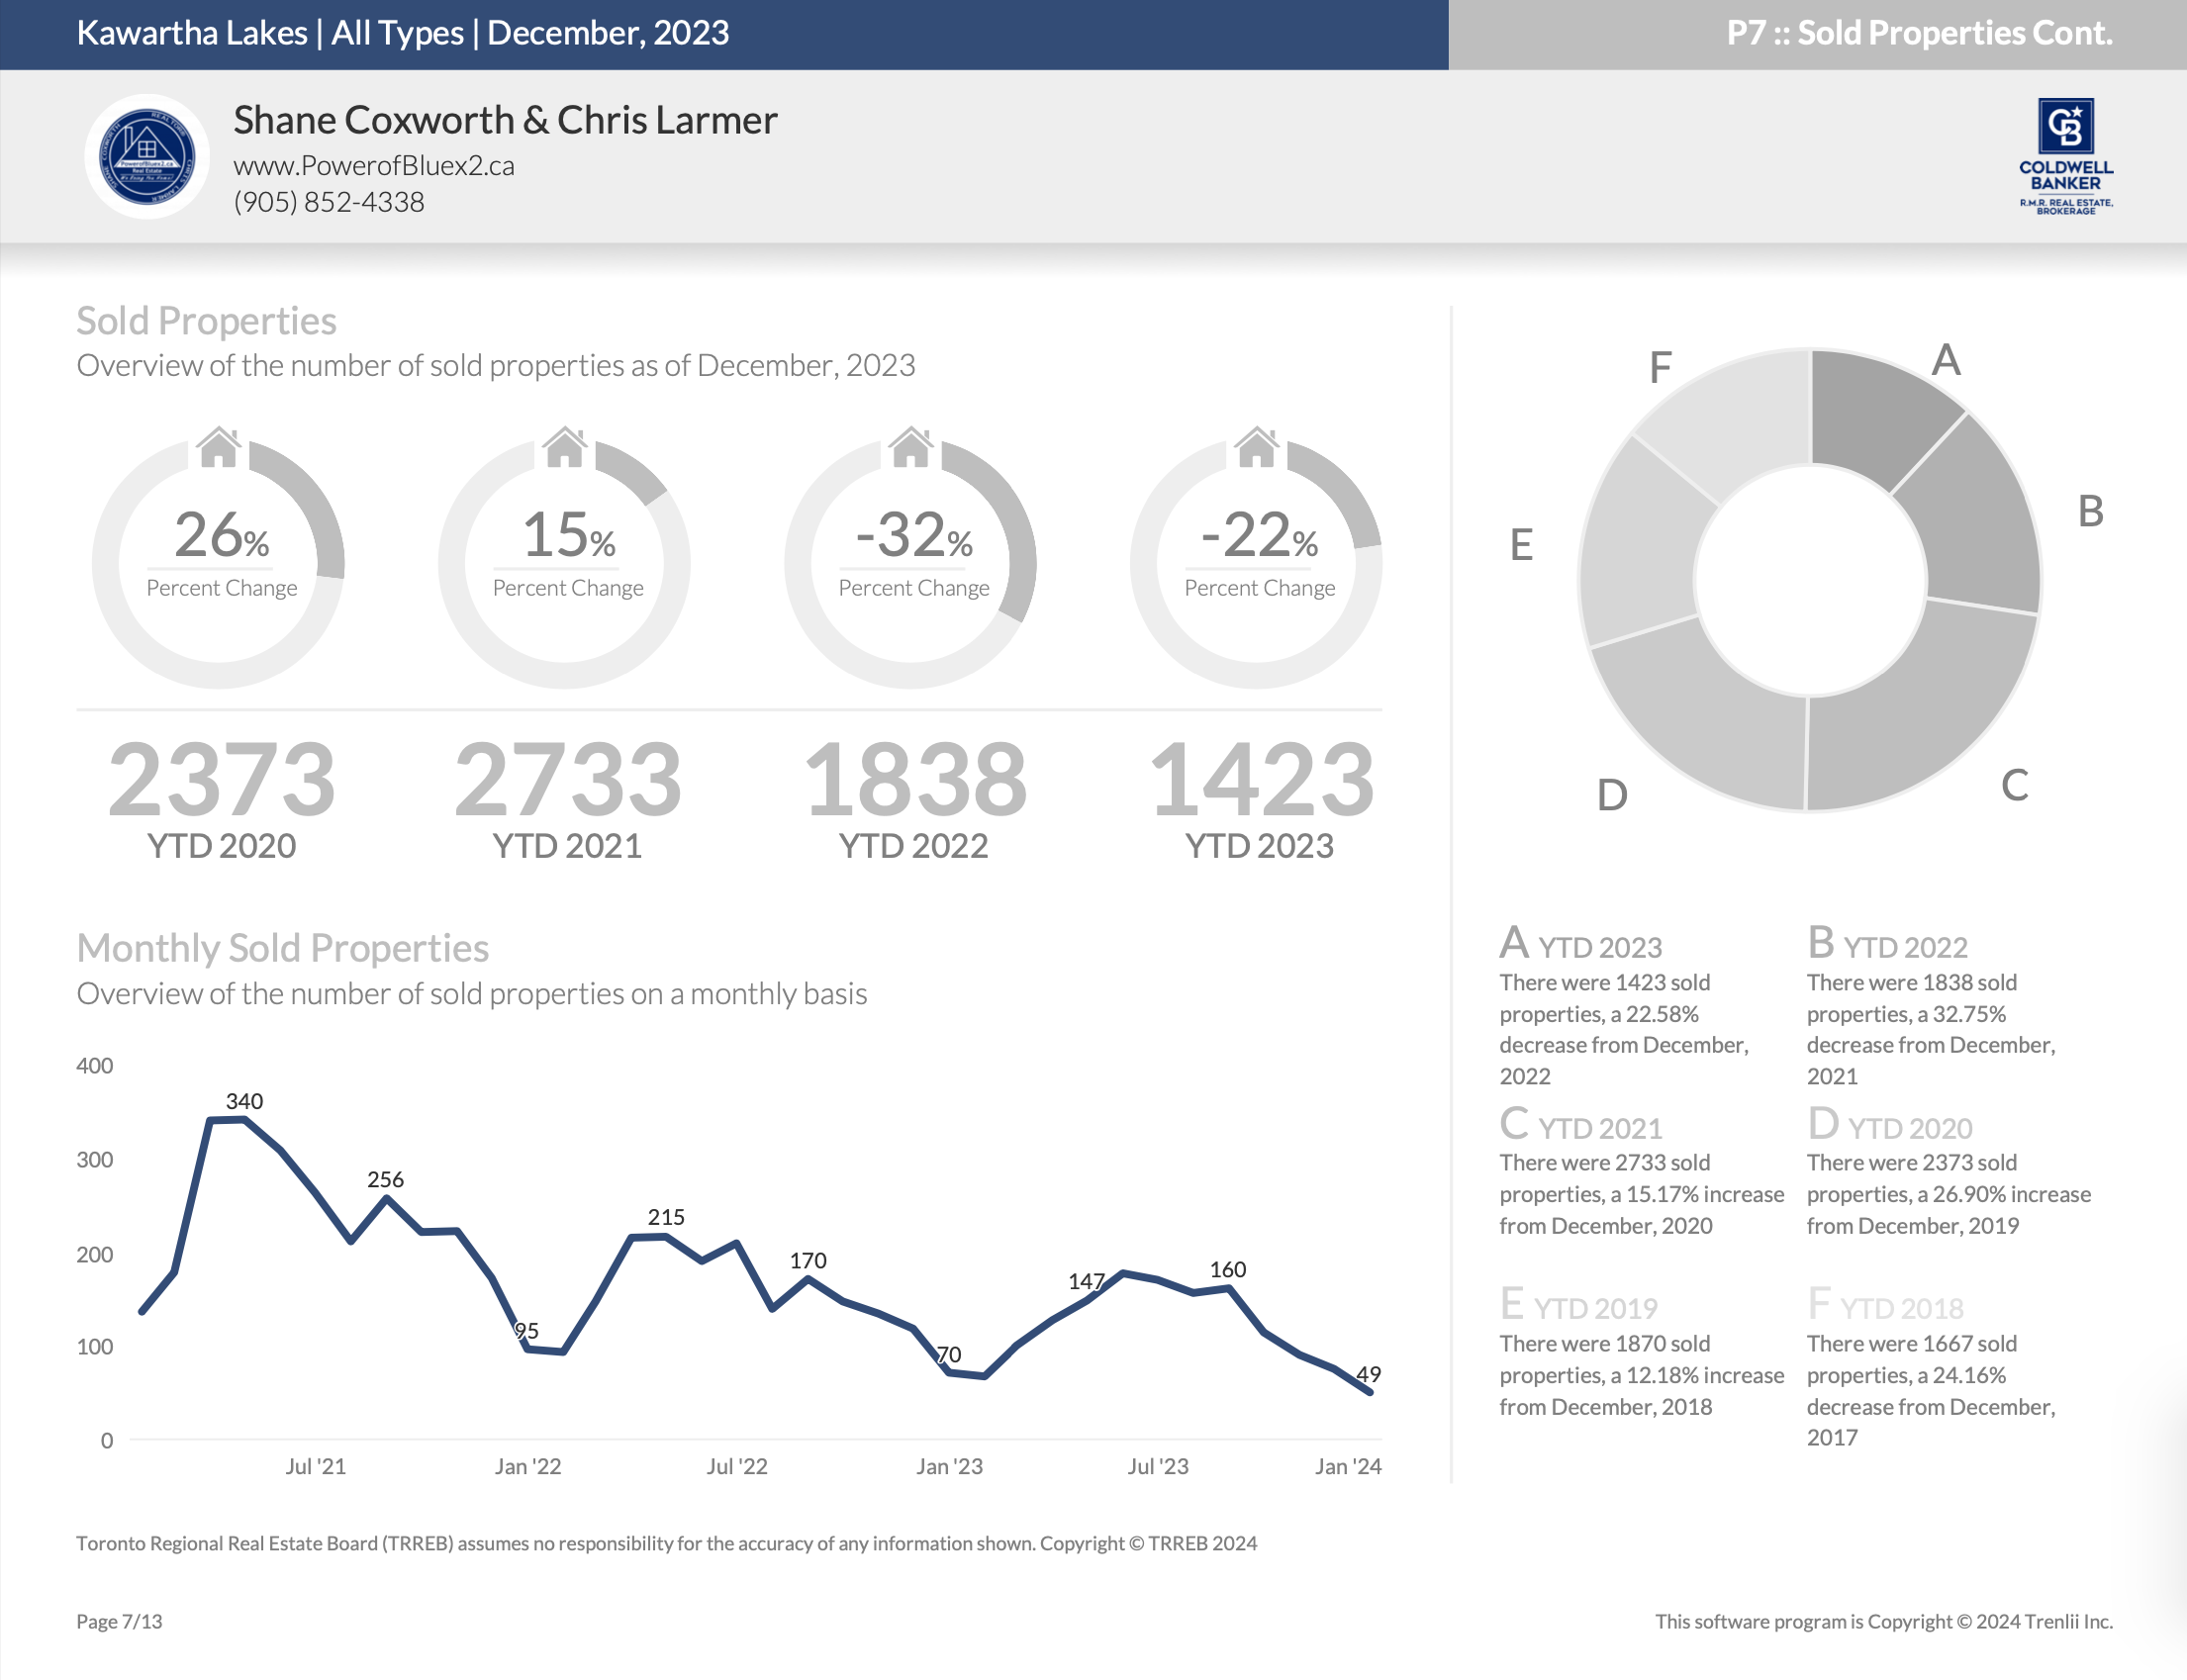
In November 2023, the real estate market experienced a shift with 39 properties listed—a 13.33% decrease from the 45 properties listed in November 2022. However, the year-to-date volume for 2023 increased to 558, reflecting a 2.01% rise from the 547 recorded in 2022.

As for property sales, November 2023 saw 19 properties changing hands—a 24.00% decrease from the 25 listings sold in November 2022. The year-to-date sales volume for 2023 decreased to 264, reflecting a 7.69% decline from the 286 transactions in 2022.

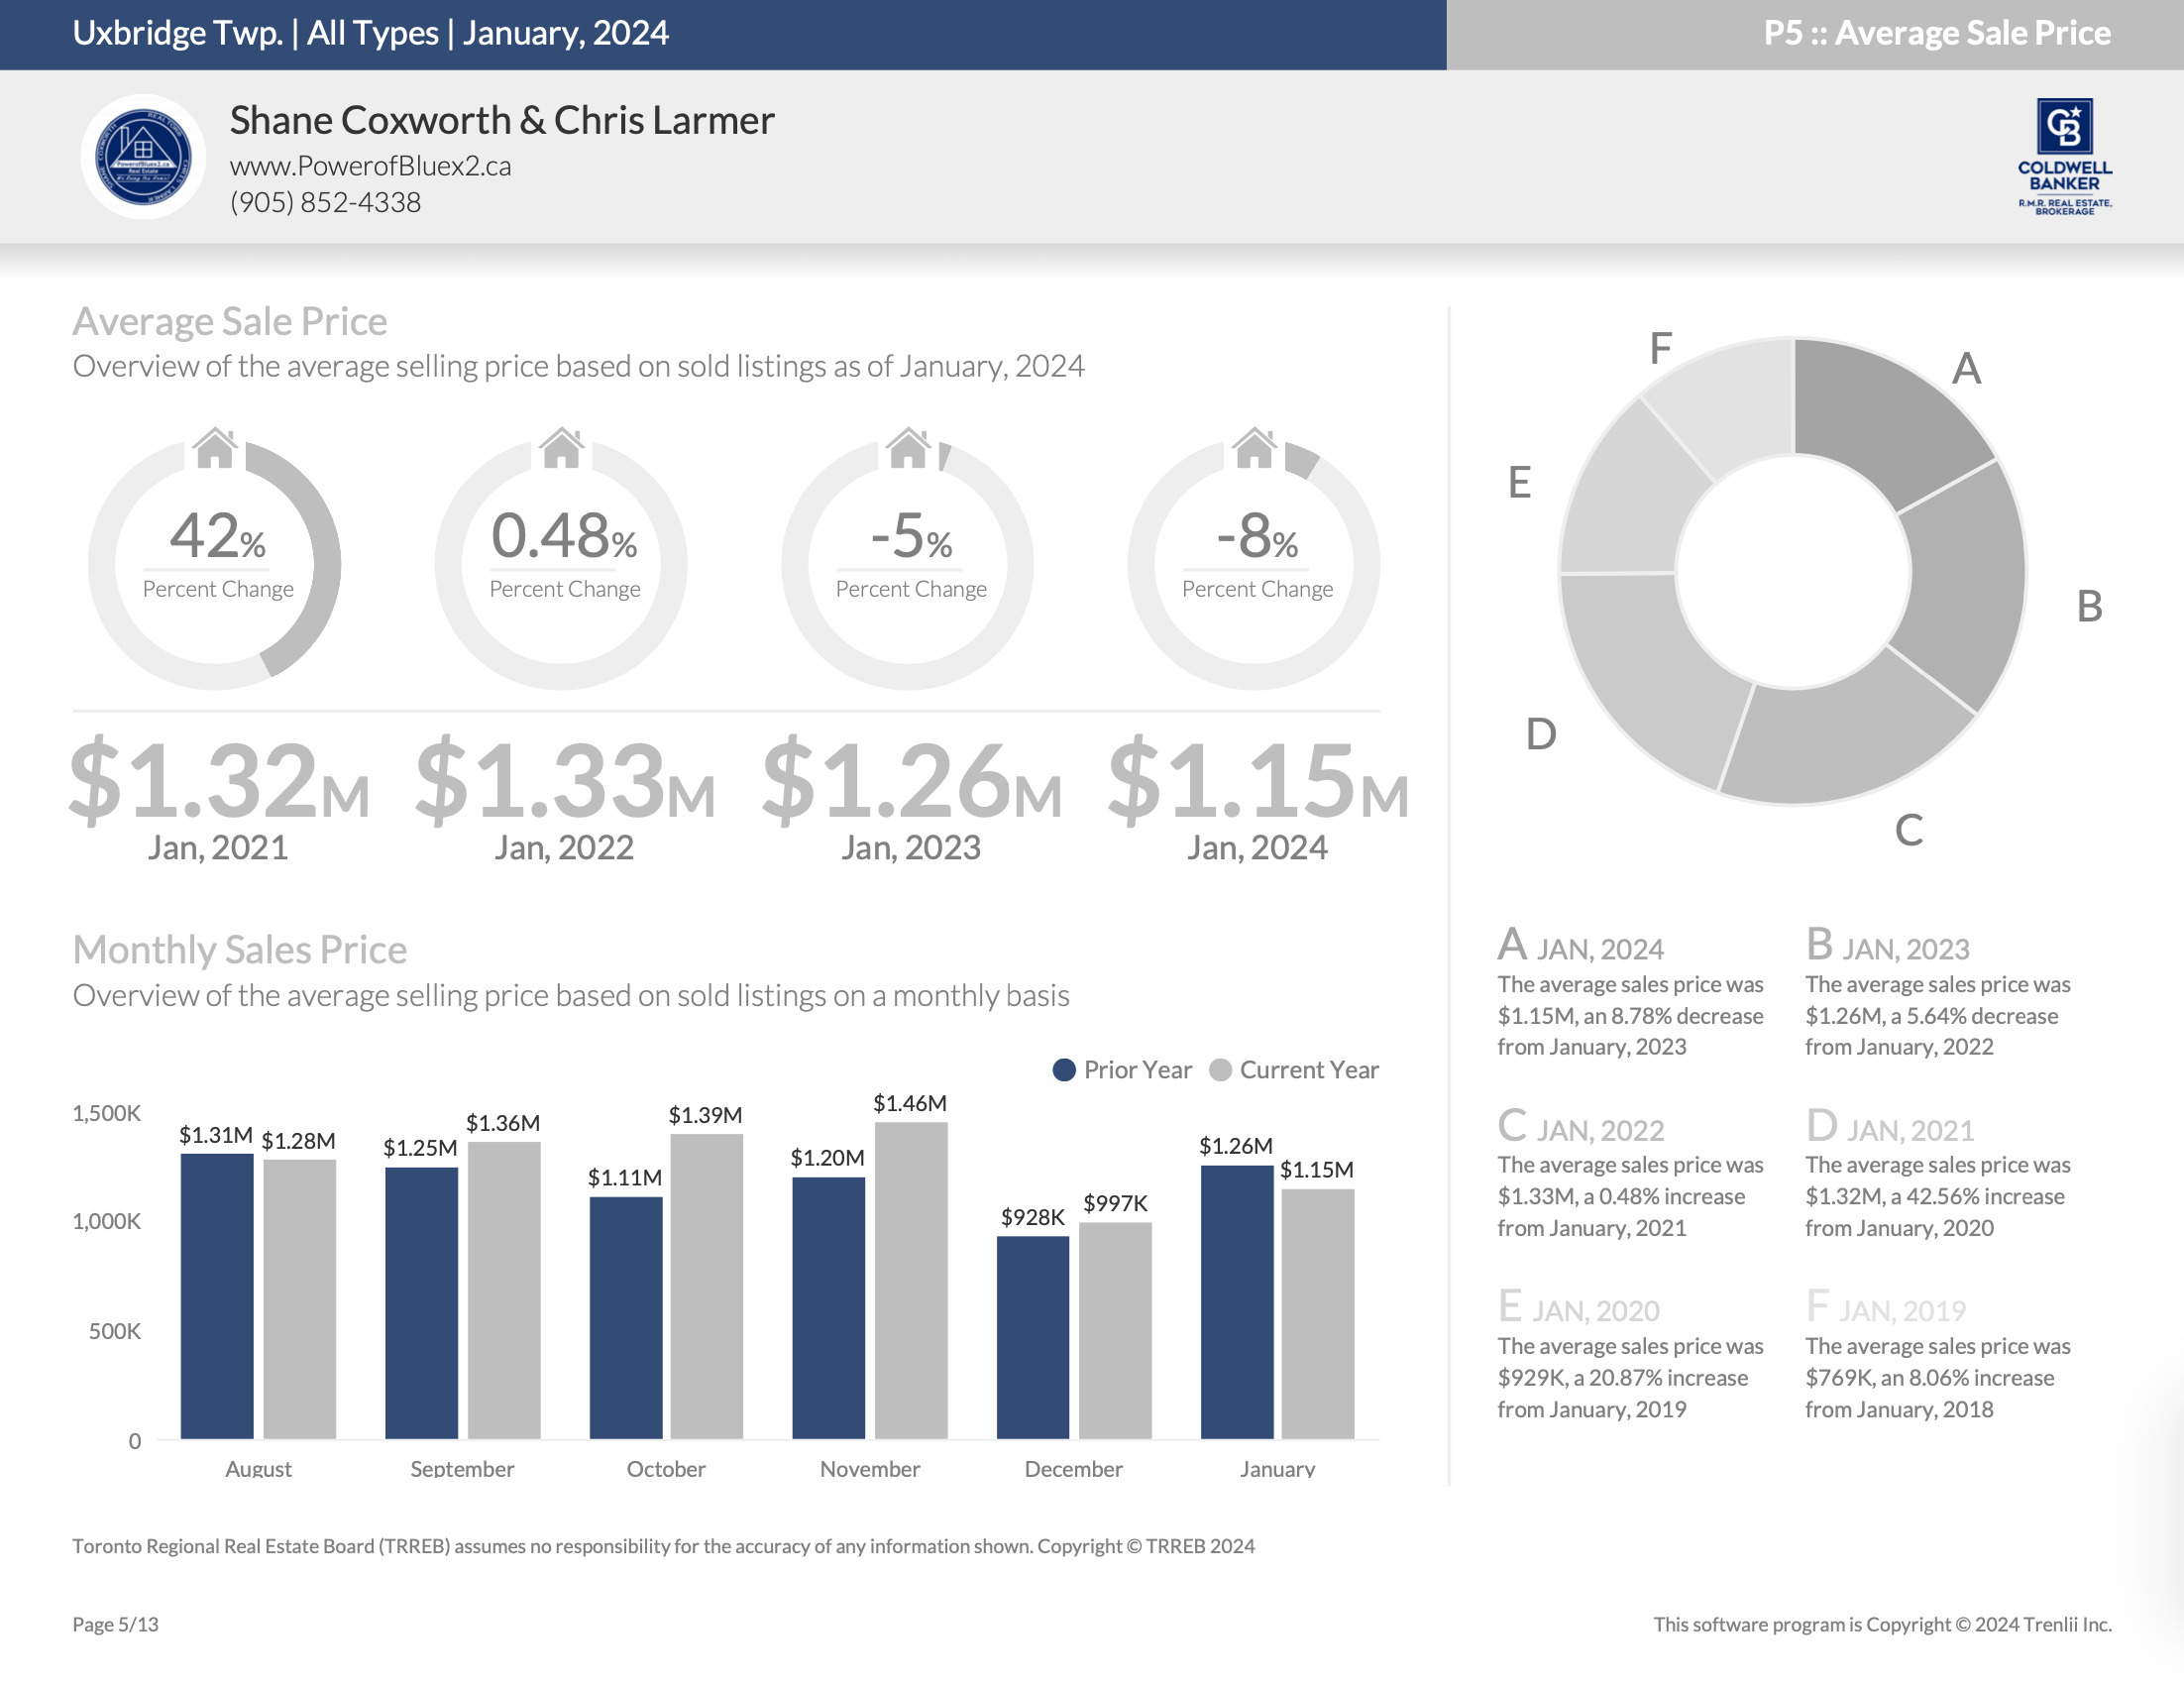
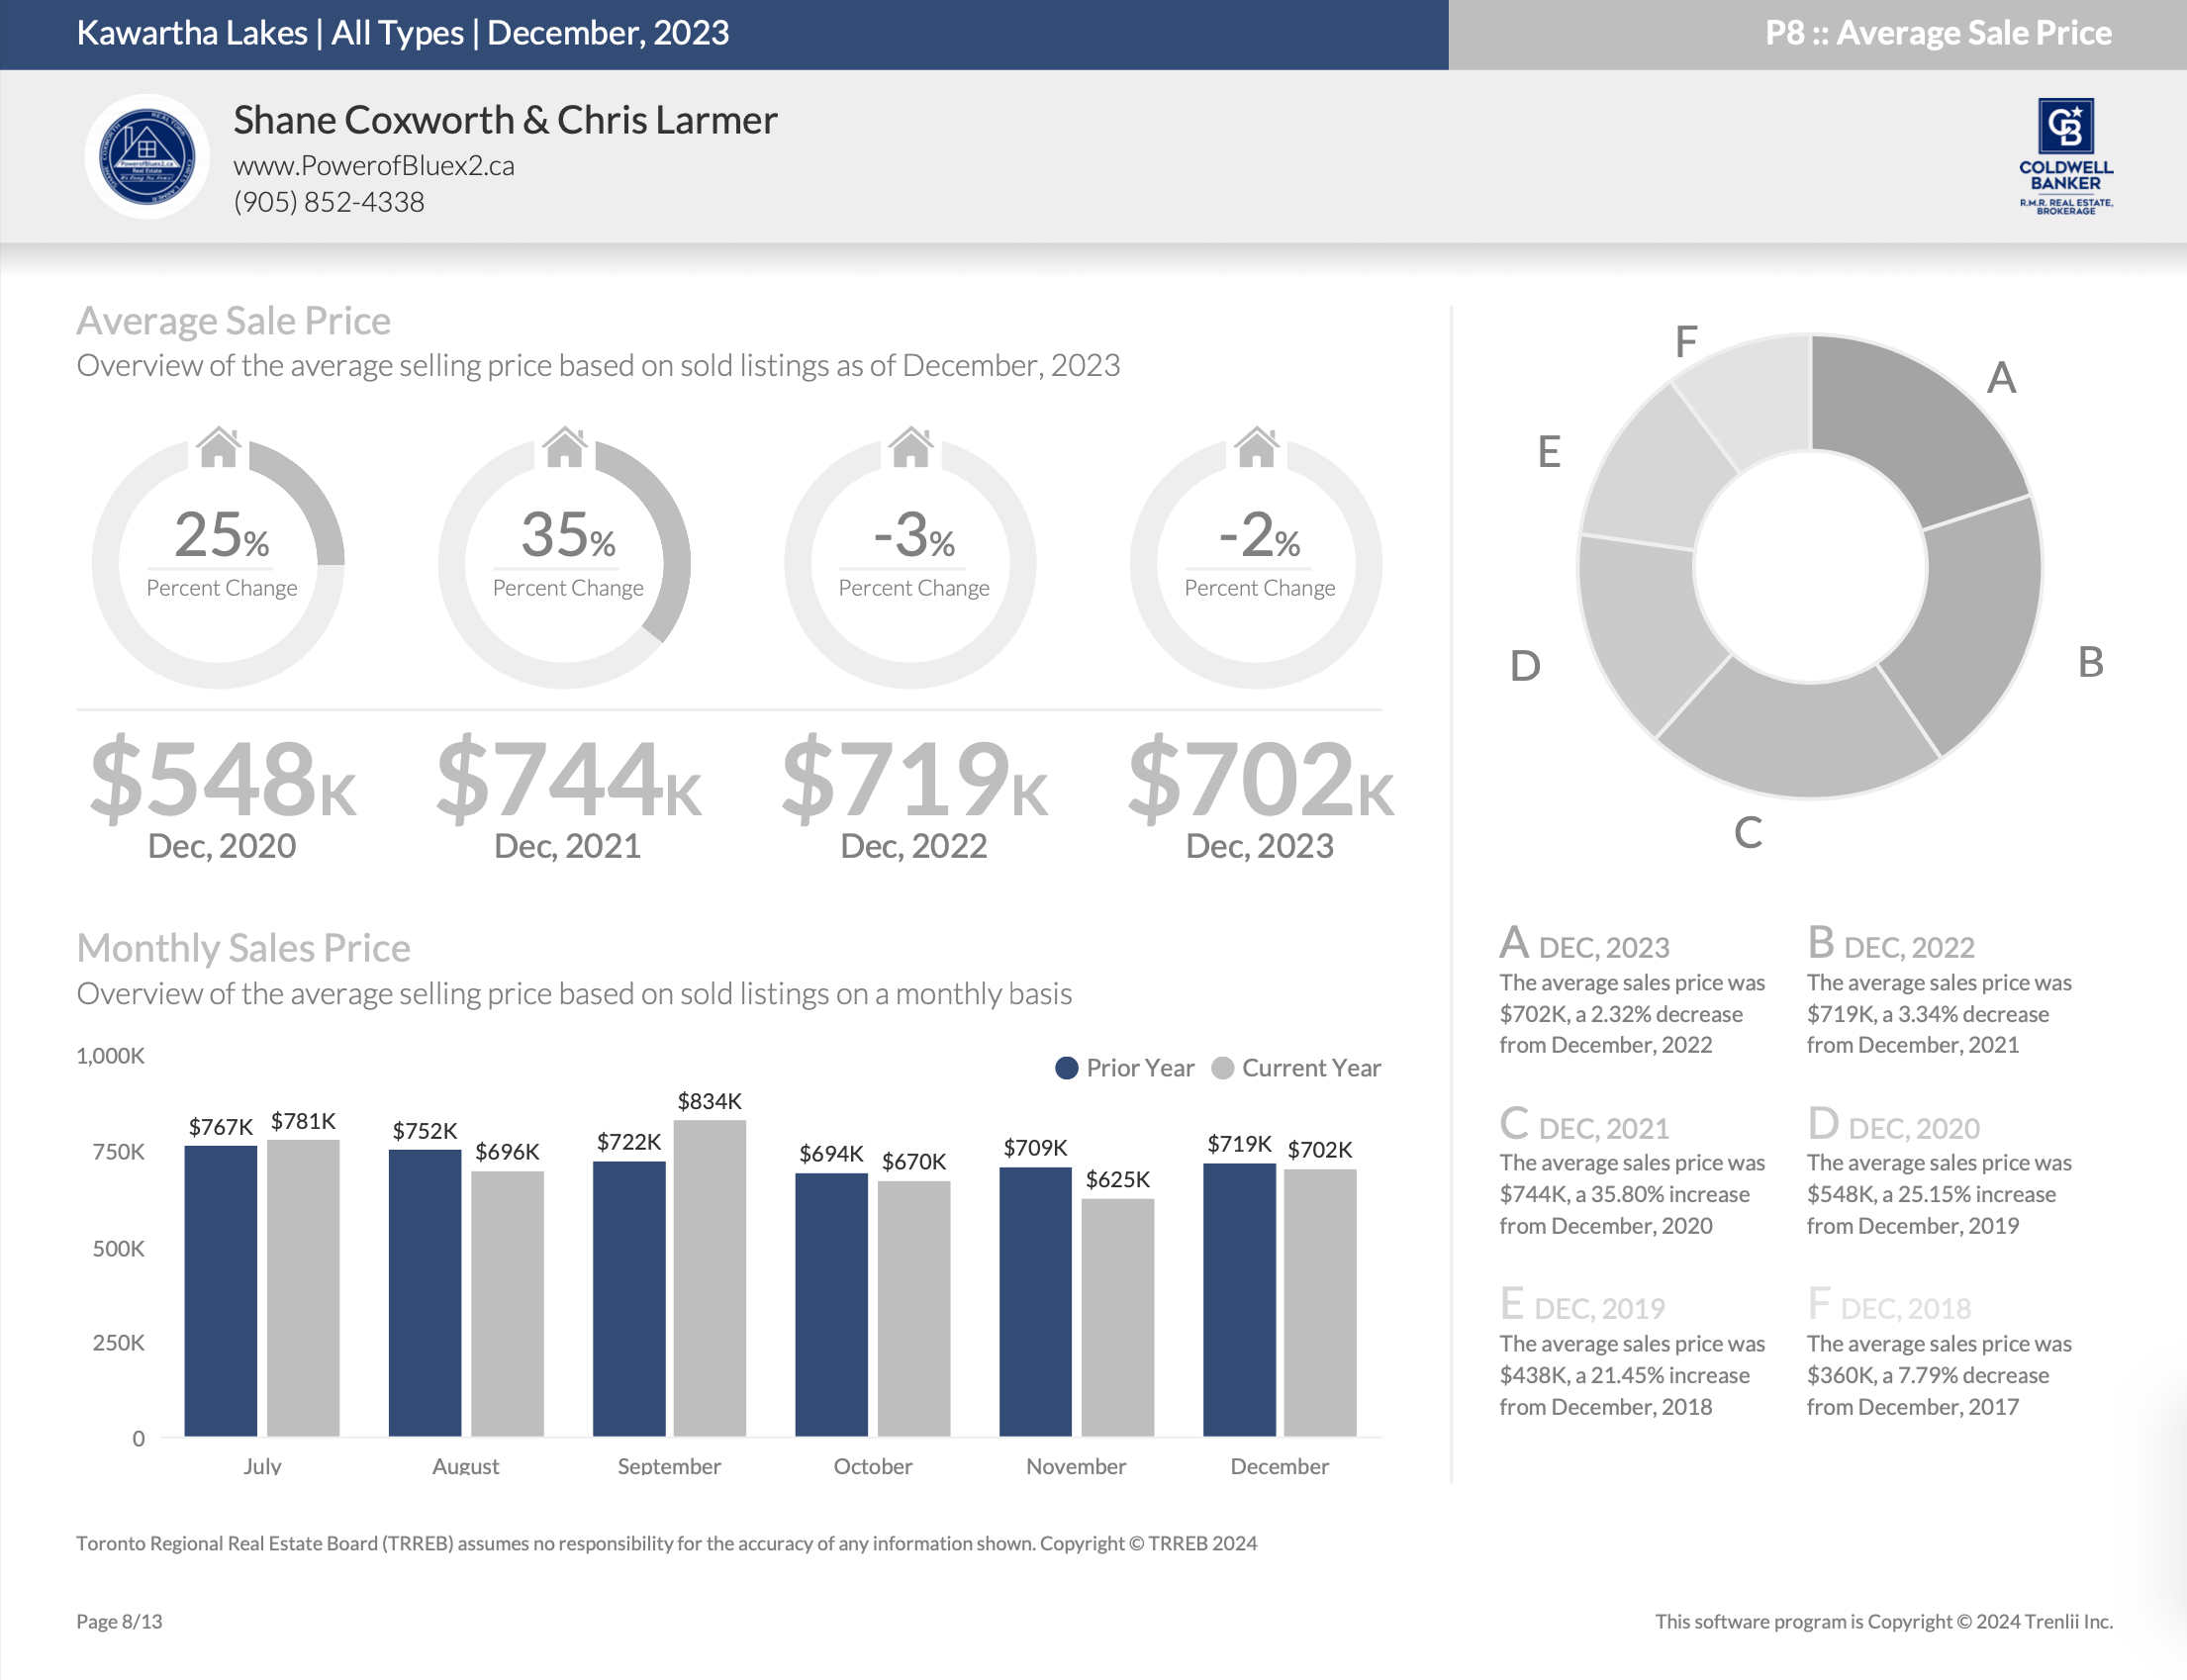
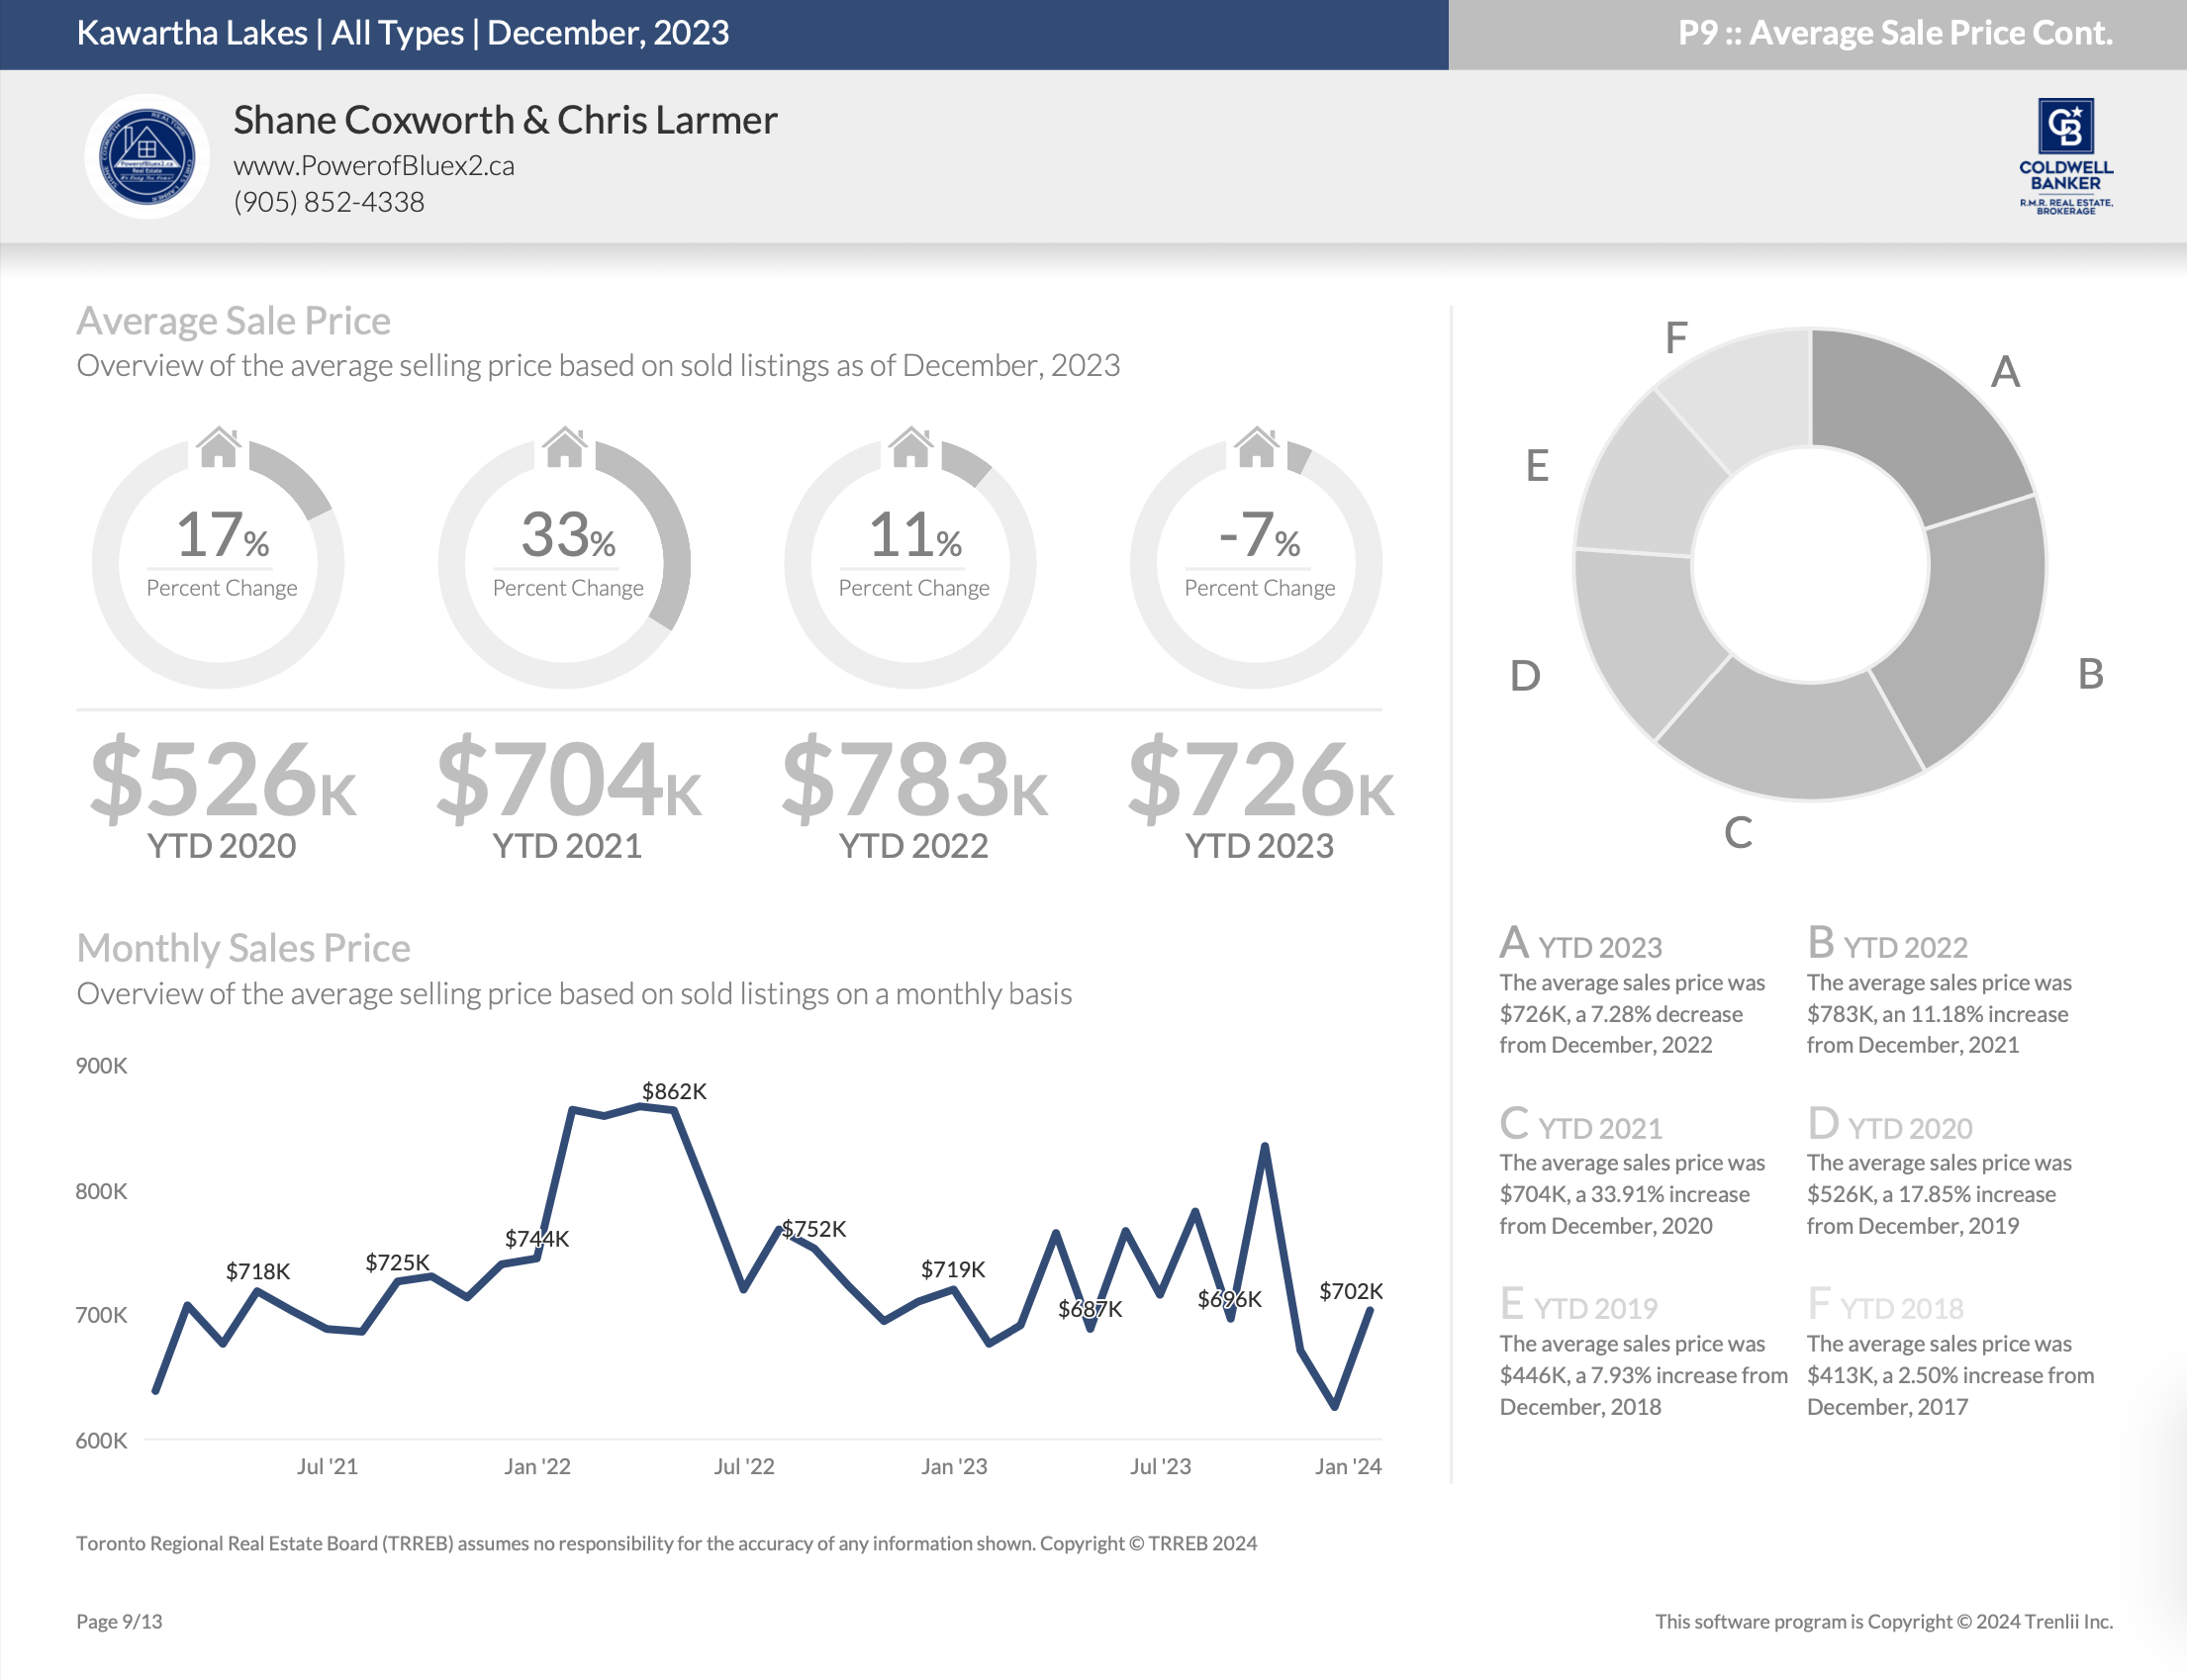
The average sales price in November 2023 surged to $1.46M, marking a substantial 21.71% increase from November 2022’s $1.20M. However, the year-to-date average sales price for 2023 is $1.33M, reflecting a modest 0.77% decrease compared to the $1.34M recorded in 2022.

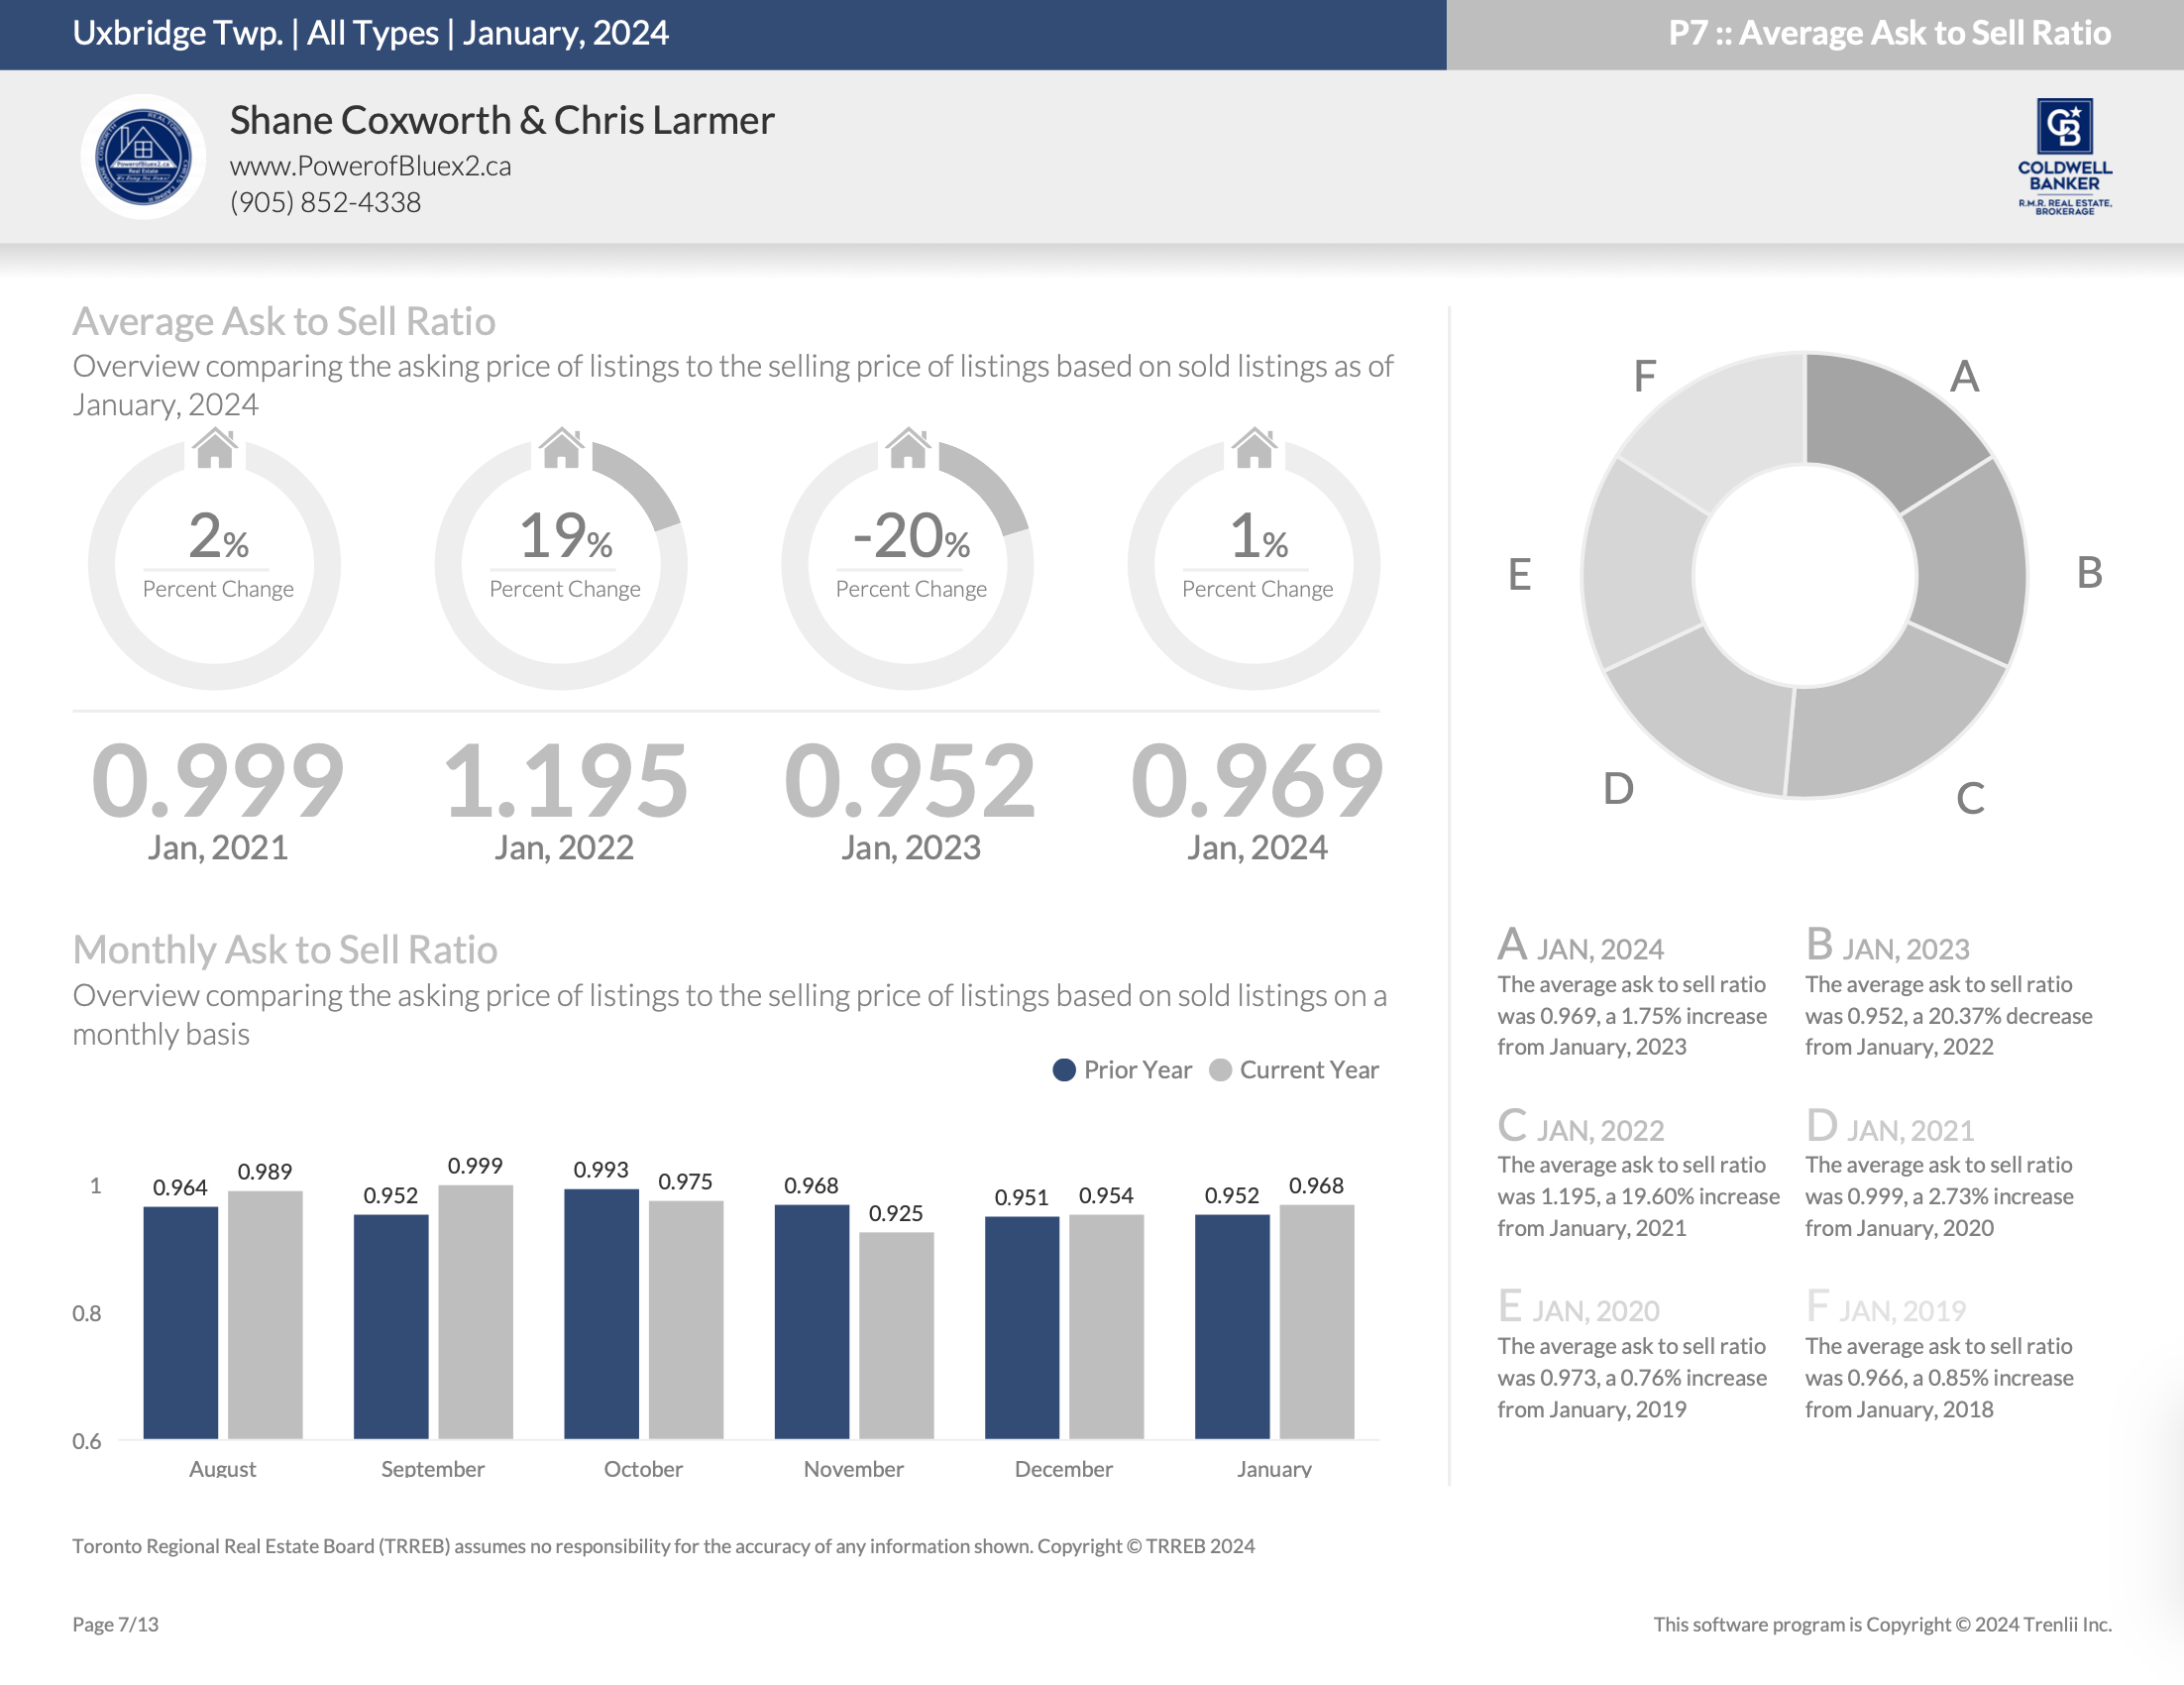
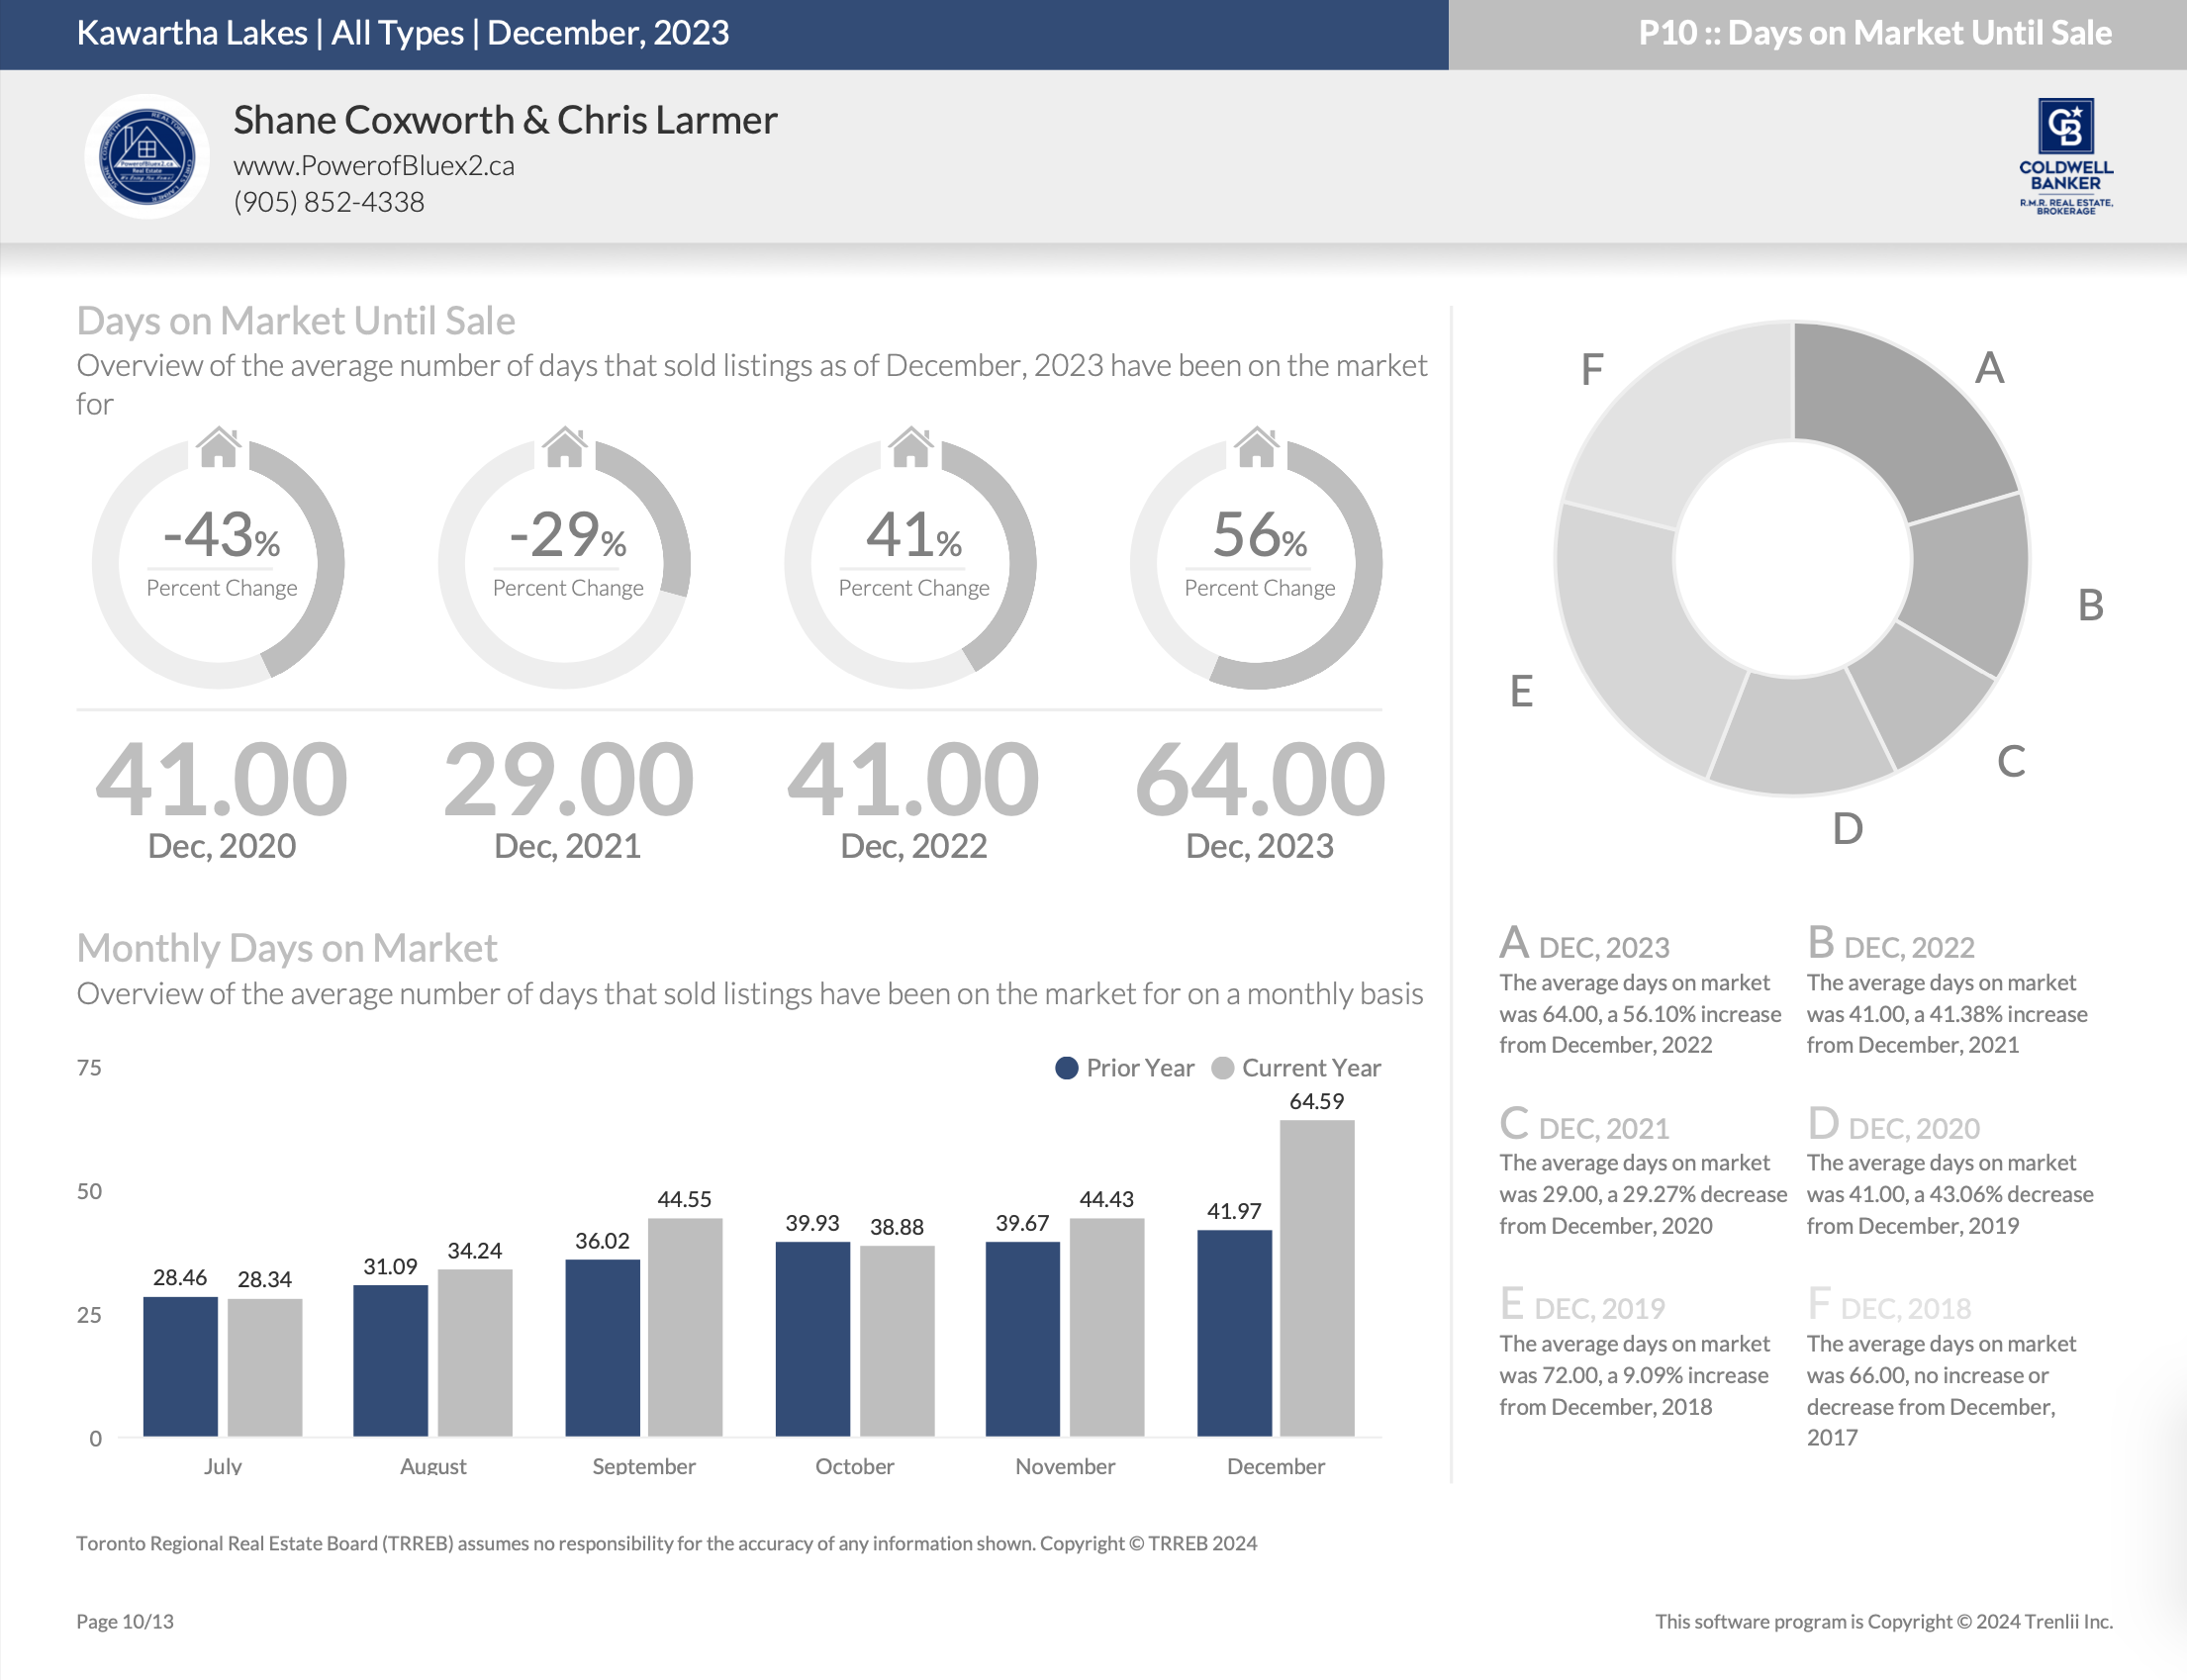
Examining market dynamics, the average ask-to-sell ratio for November 2023 is 0.925, indicating a 4.46% decrease from November 2022’s 0.968 ratio. The year-to-date average ask-to-sell ratio for 2023 is 0.990, showing a 6.50% decrease from the 1.058 ratio in 2022. These figures highlight the evolving trends in both listing and selling dynamics within the real estate market.


Uxbridge Housing November 2023


Quick Review

Uxbridge Housing November 2023


New Listings – November 2023

Uxbridge Housing November 2023


New Listings – Year-To-Date


Average Asking Price – November 2023

Uxbridge Housing November 2023


Average Asking Price – Year-to-Date


Number of Properties Sold – November 2023

Uxbridge Housing November 2023


Number of Properties Sold – Year-to-Date


Average Sold Price – November 2023

Uxbridge Housing November 2023


Average Sold Price – Year-to-Date


Days on Market – November 2023

Uxbridge Housing November 2023


Days on Market – Year-to-Date


Average List Price to Sell Price Ratio – November 2023

Uxbridge Housing November 2023


Average List Price to Sell Price Ratio – Year-to-Date


*Information is believed to be accurate at time of posting but is not guaranteed to be correct 

Not intended as a solicitation if your property is already listed by another broker. Affiliated real estate agents are independent contractor sales associates, not employees. ©2021 Coldwell Banker. All Rights Reserved. Coldwell Banker and the Coldwell Banker logos are trademarks of Coldwell Banker Real Estate LLC. The Coldwell Banker® System is comprised of company owned offices which are owned by a subsidiary of Realogy Brokerage Group LLC and franchised offices which are independently owned and operated. The Coldwell Banker System fully supports the principles of the Fair Housing Act and the Equal Opportunity Act.


Click below for more reports

Durham Region

Township of Scugog

Township Brock

City of Kawartha Lakes


Neighbour News

Real Estate Stats December 7, 2023

Scugog Housing November 2023

Scugog Housing November 2023

Township of Scugog

Housing Market Report for November 2023

Here is the Township of Scugog  Housing November 2023 report (all housing types), with reports from the Toronto Regional Real Estate Board and the Central Lakes Association of REALTORS®  included.

This housing report for Township of Scugog includes the number of new listings, average list price, number of properties sold, average selling price, average days on market and average asking price to selling price ratio for all property types within the Township of Scugog.


Scroll to the bottom for links to take you to the housing market reports for Durham, Uxbridge, Brock and the Kawartha Lakes


CREA HOUSING MARKET REPORT – NOVEMBER 2023


From Toronto Regional Real Estate Board


Toronto Regional Real Estate Board – Market Stats At A Glance – November 2023


Read the Toronto Regional Real Estate Board  Market Watch Report 


Durham REALTORS® Report November 2023 Housing Statistics


Read the Durham Association of REALTORS® FULL Real Estate Report


Township of Scugog

Township of Scugog Full Report


*Some values may vary slightly based on the exact date and time the reports were generated.


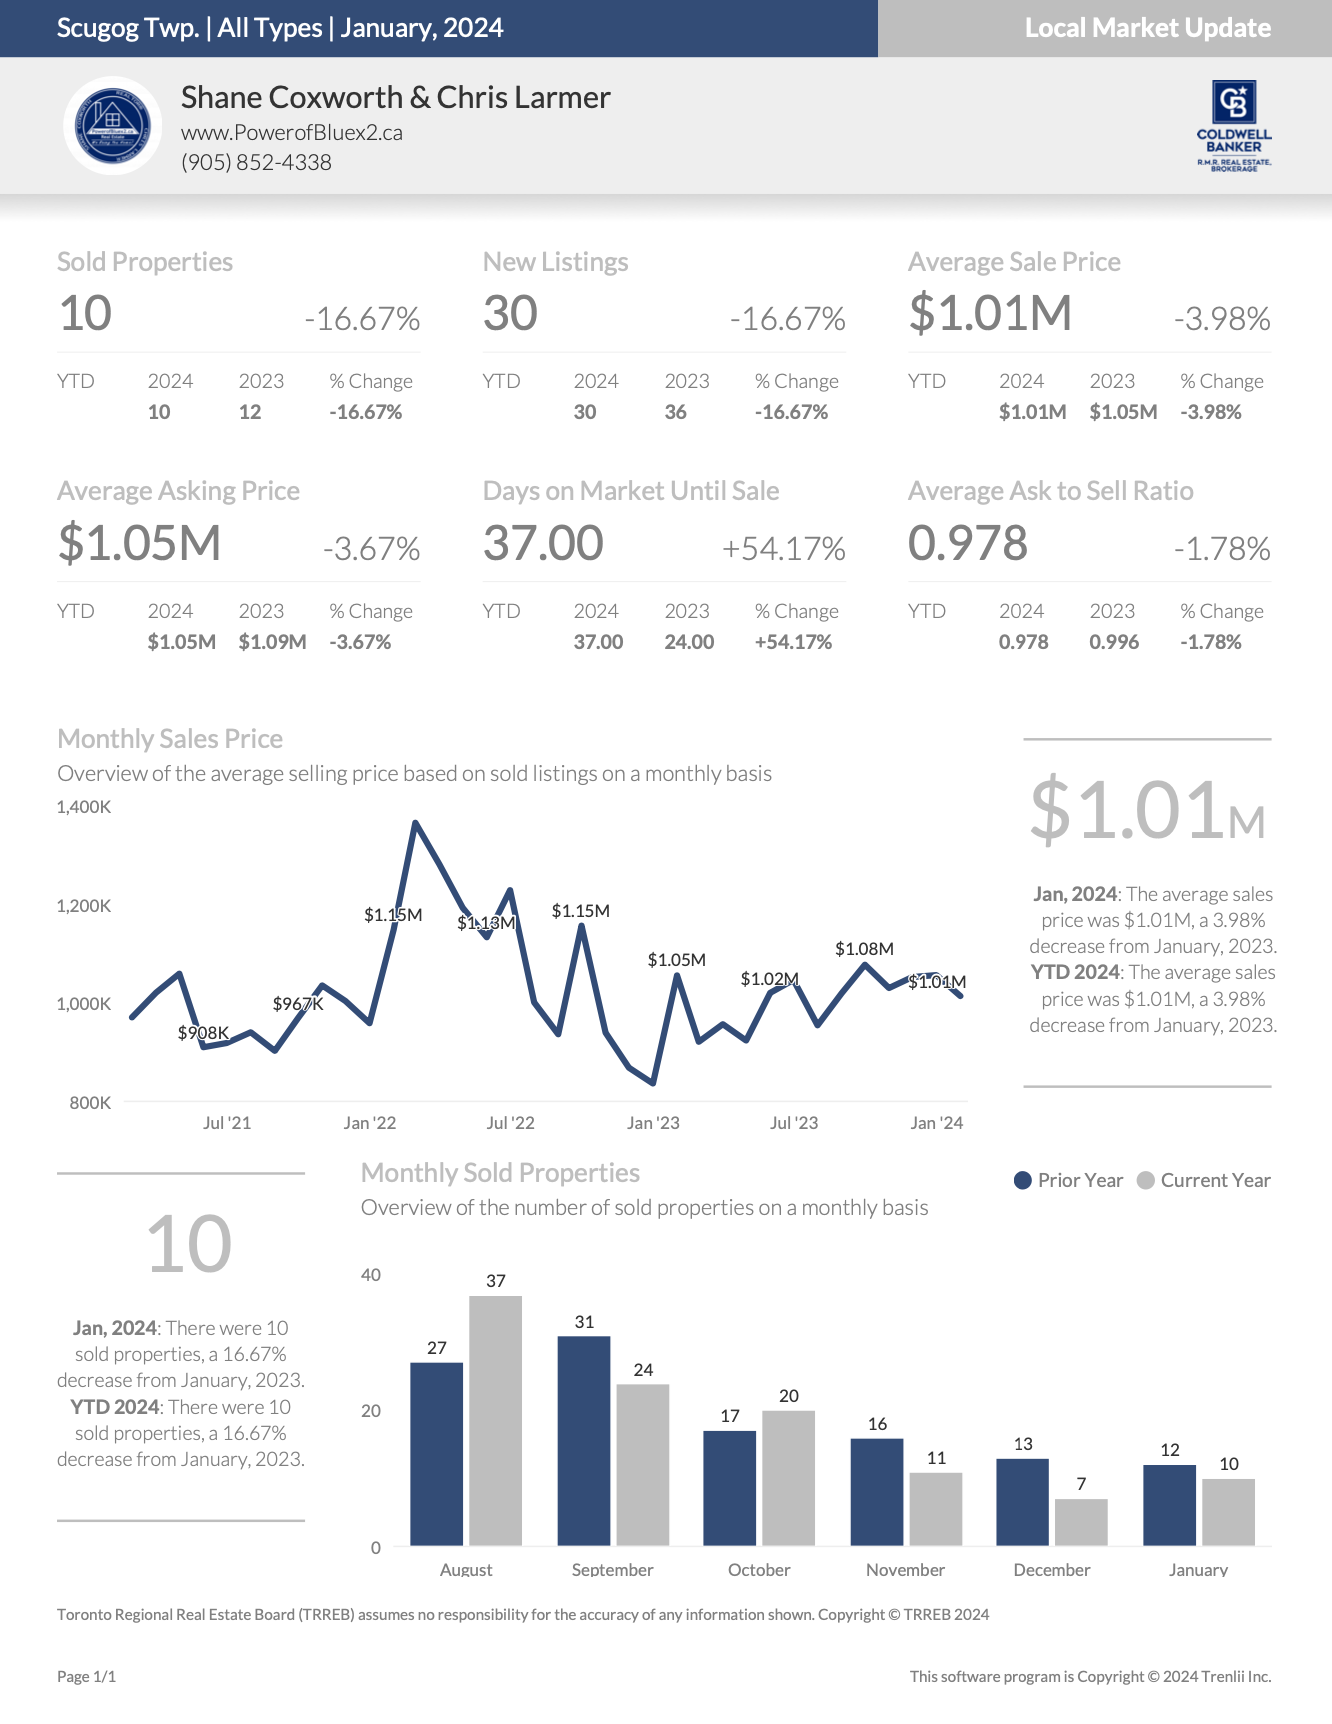
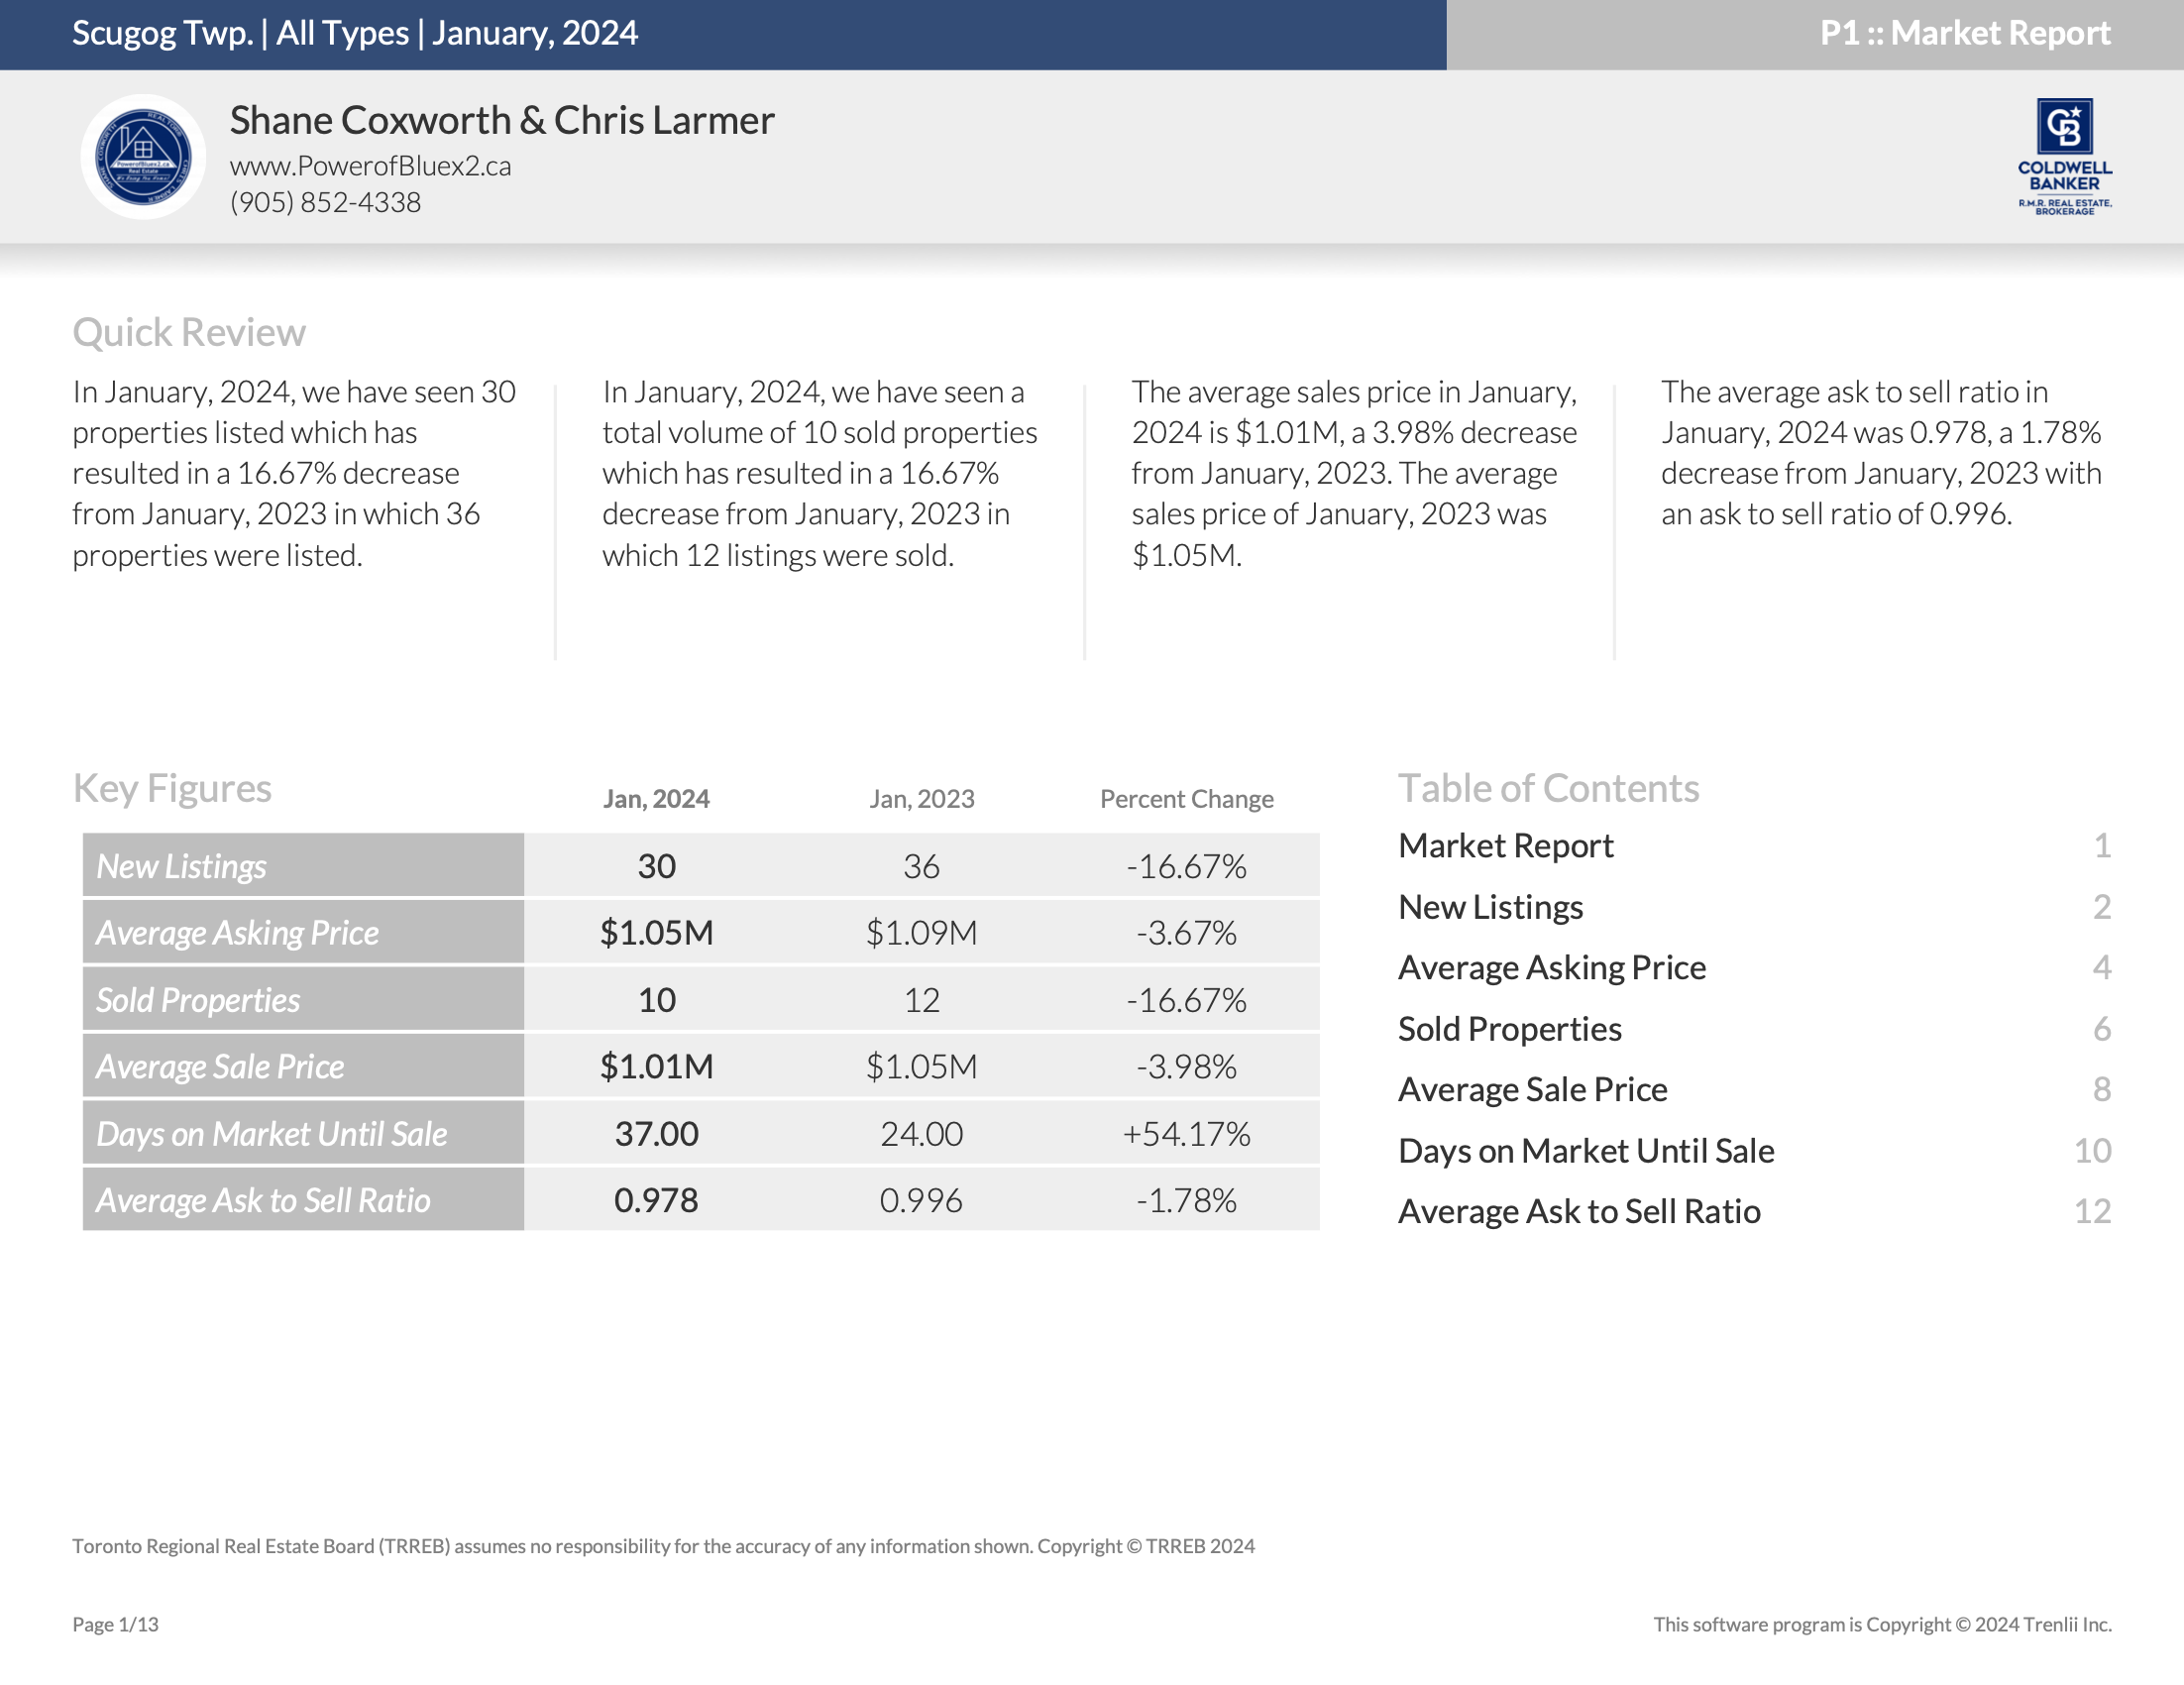
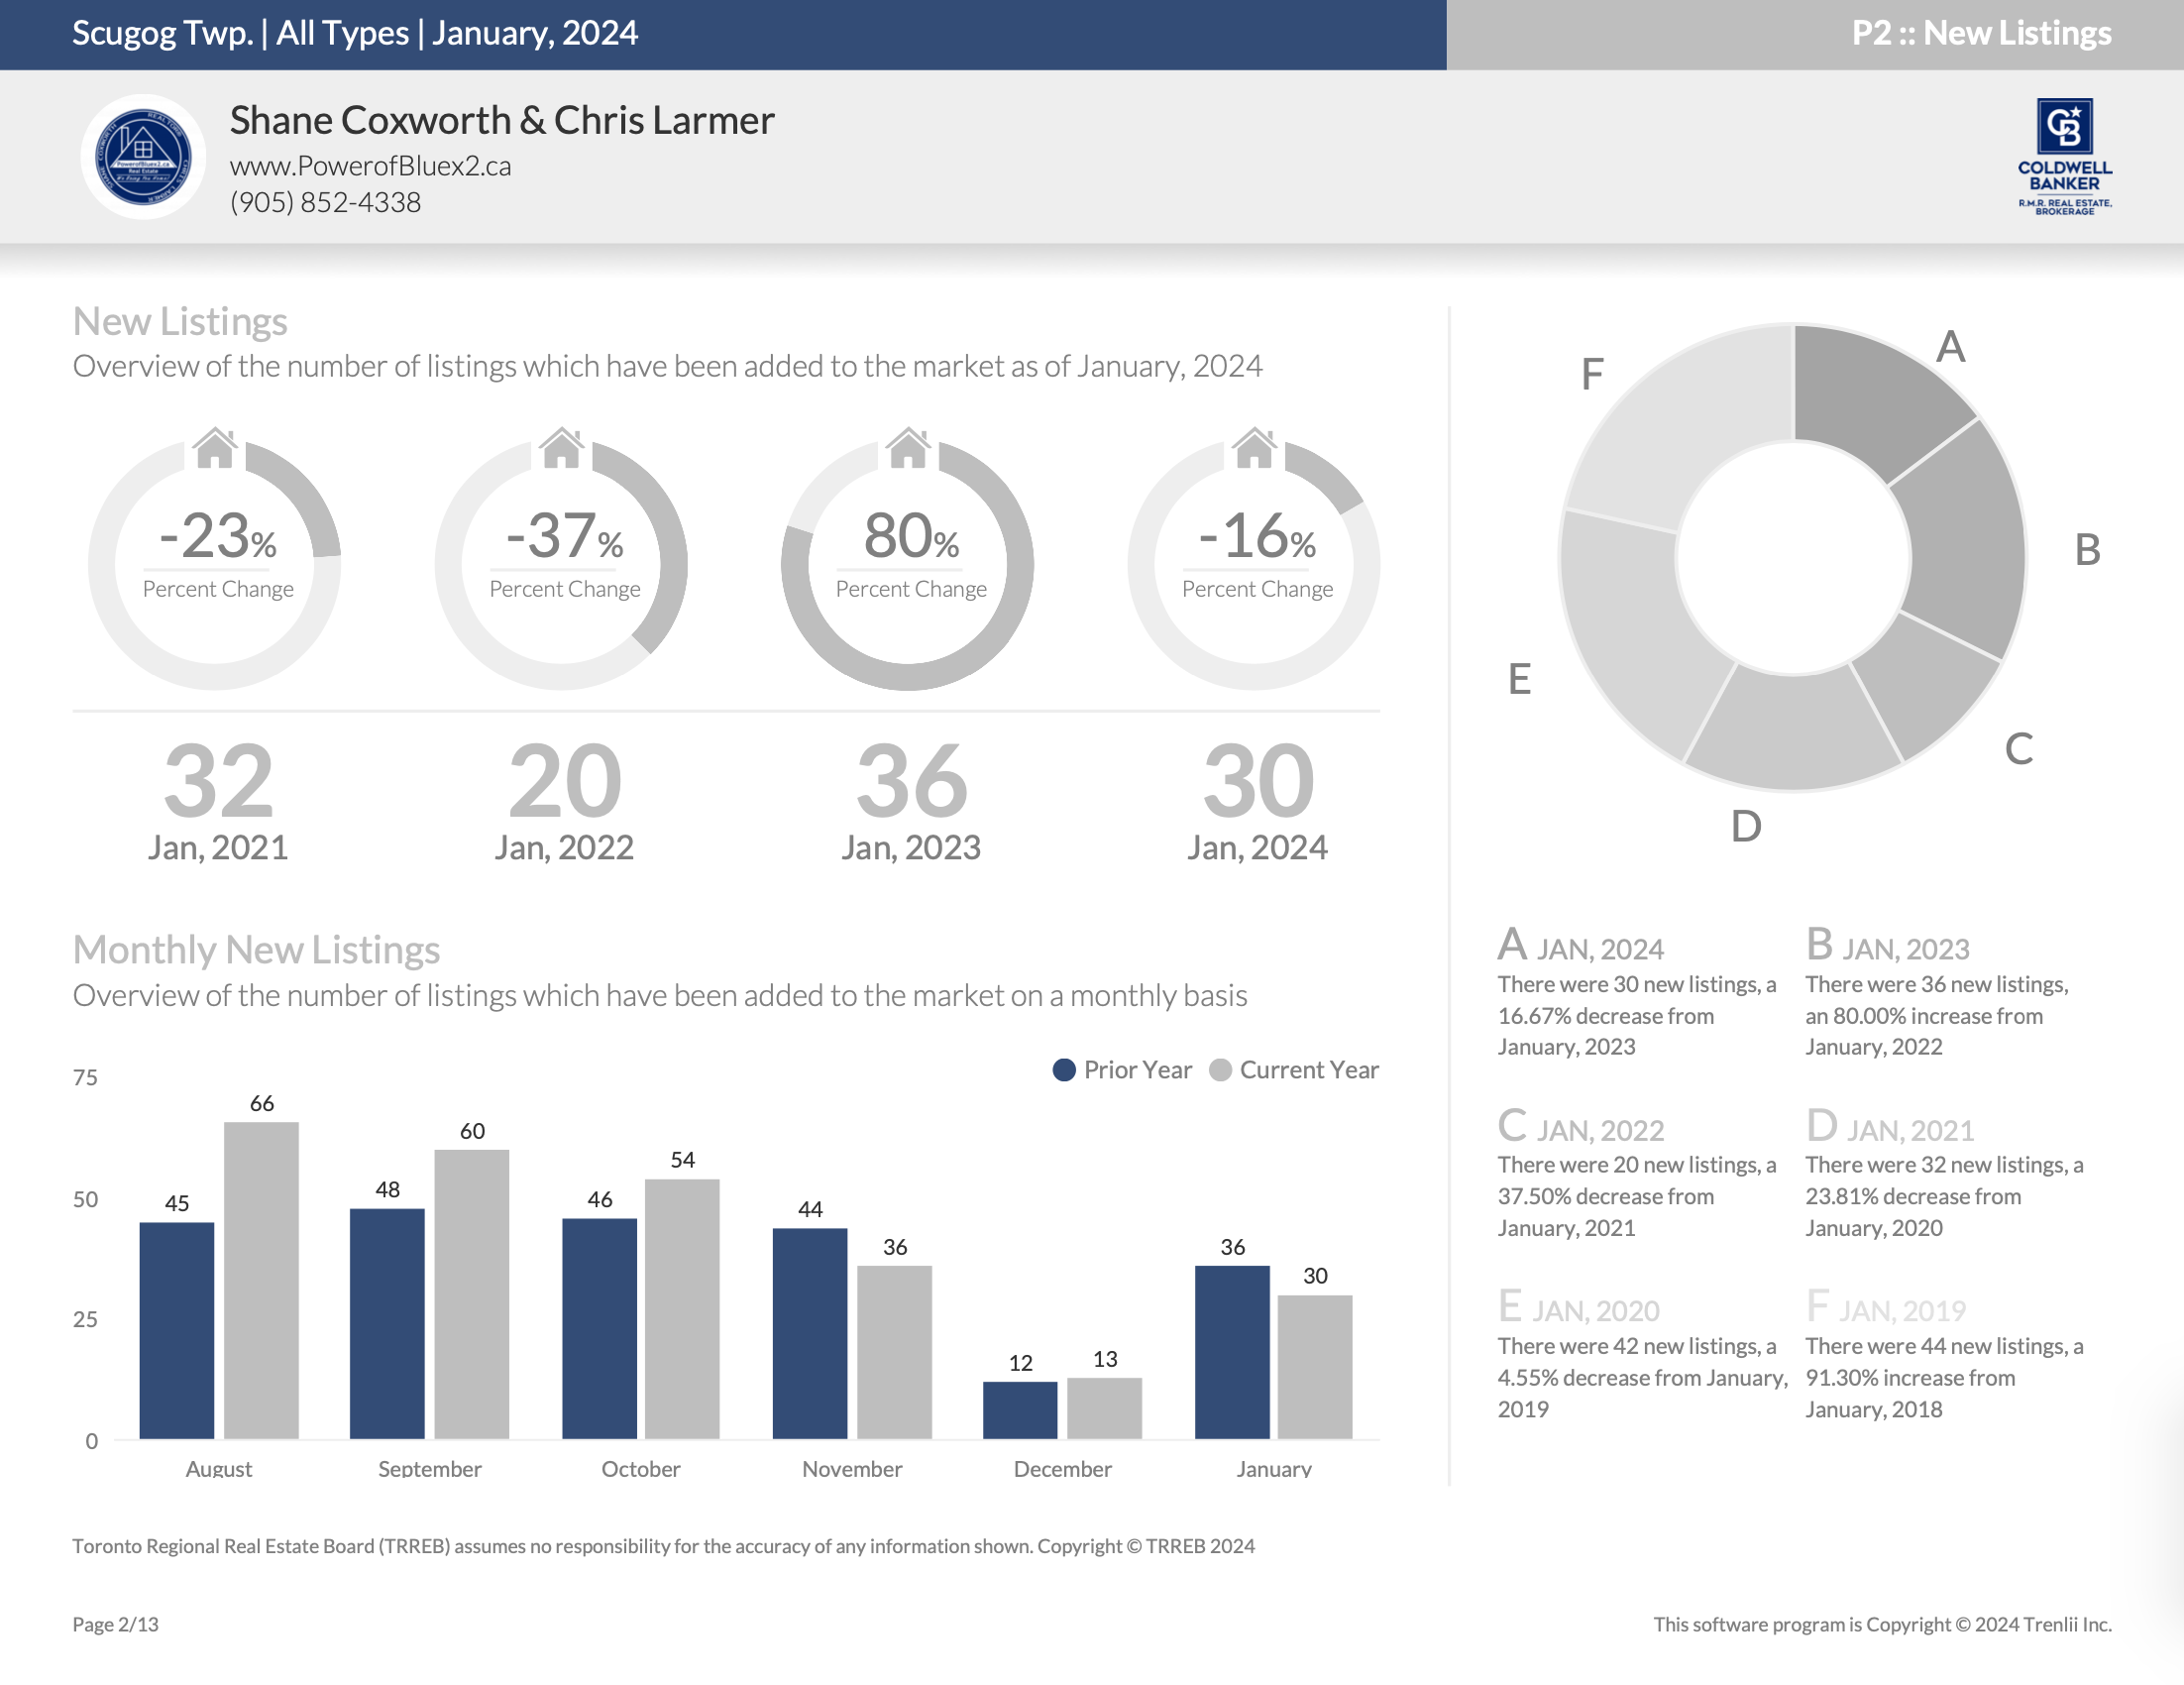
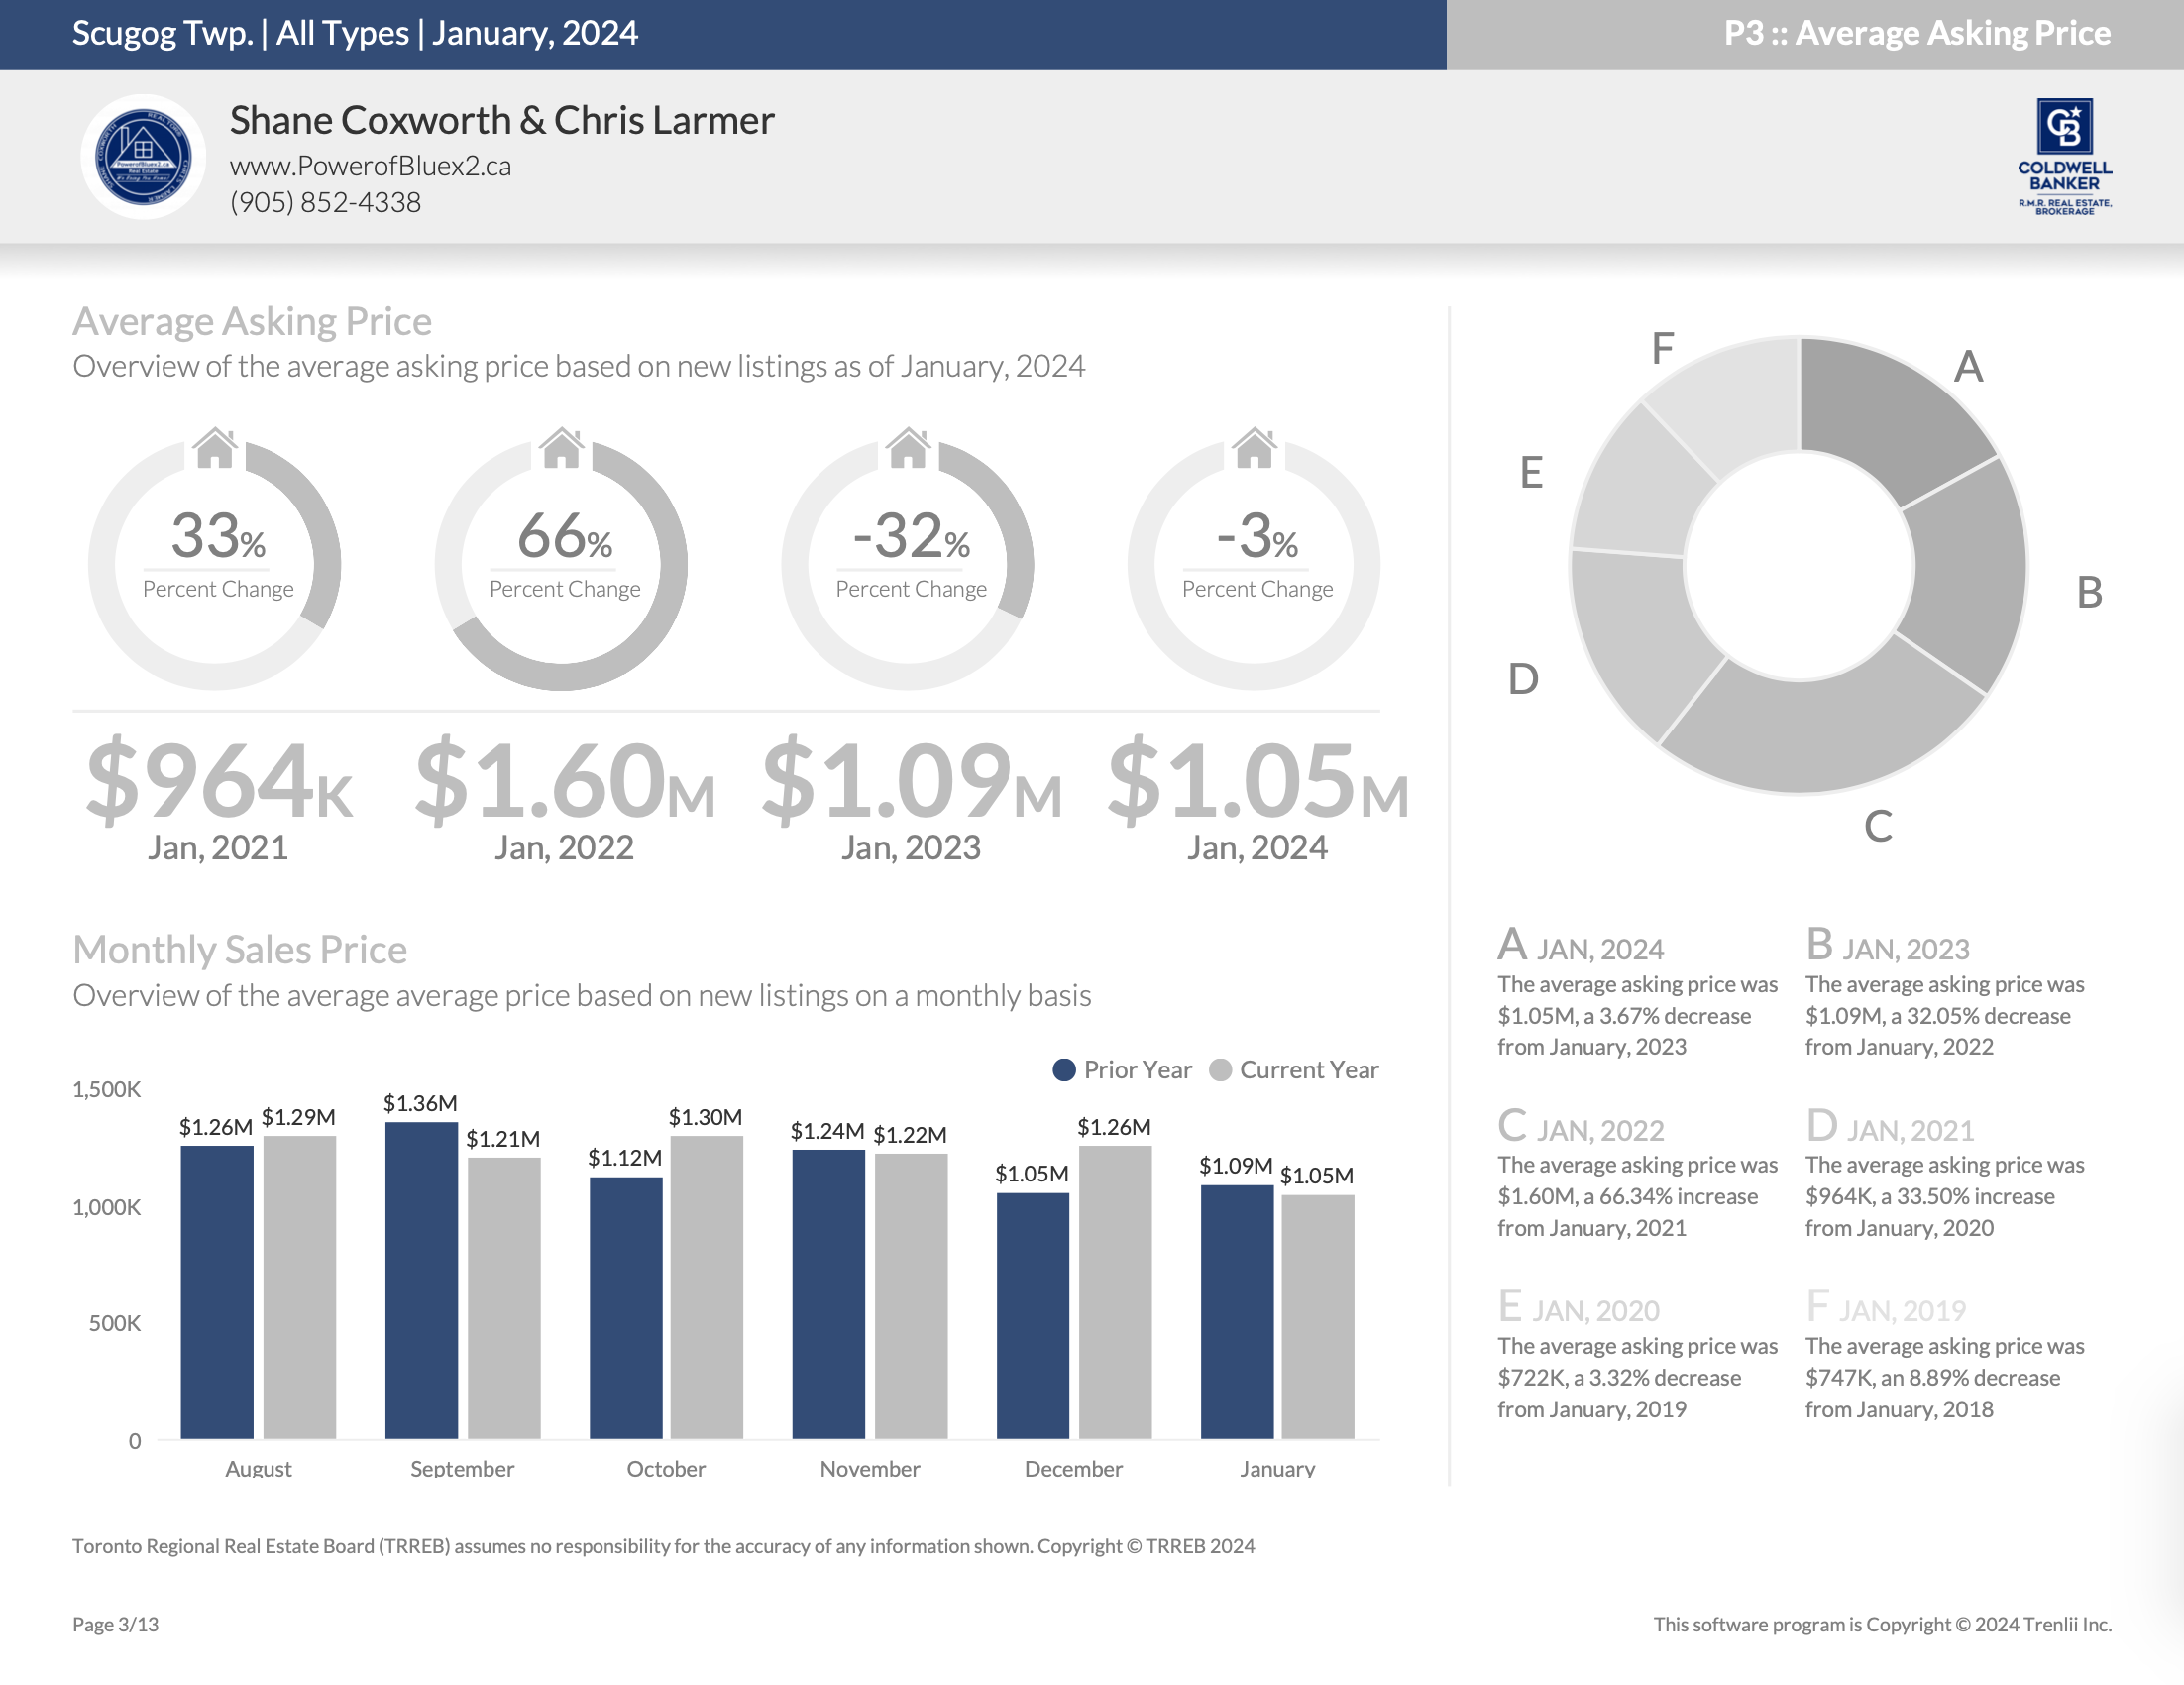
In November 2023, the real estate landscape witnessed a shift with 36 properties listed, marking an 18.18% decrease from the 44 properties listed in November 2022. However, the year-to-date volume for 2023 increased to 599, showing a 12.17% rise from the 534 recorded in 2022.

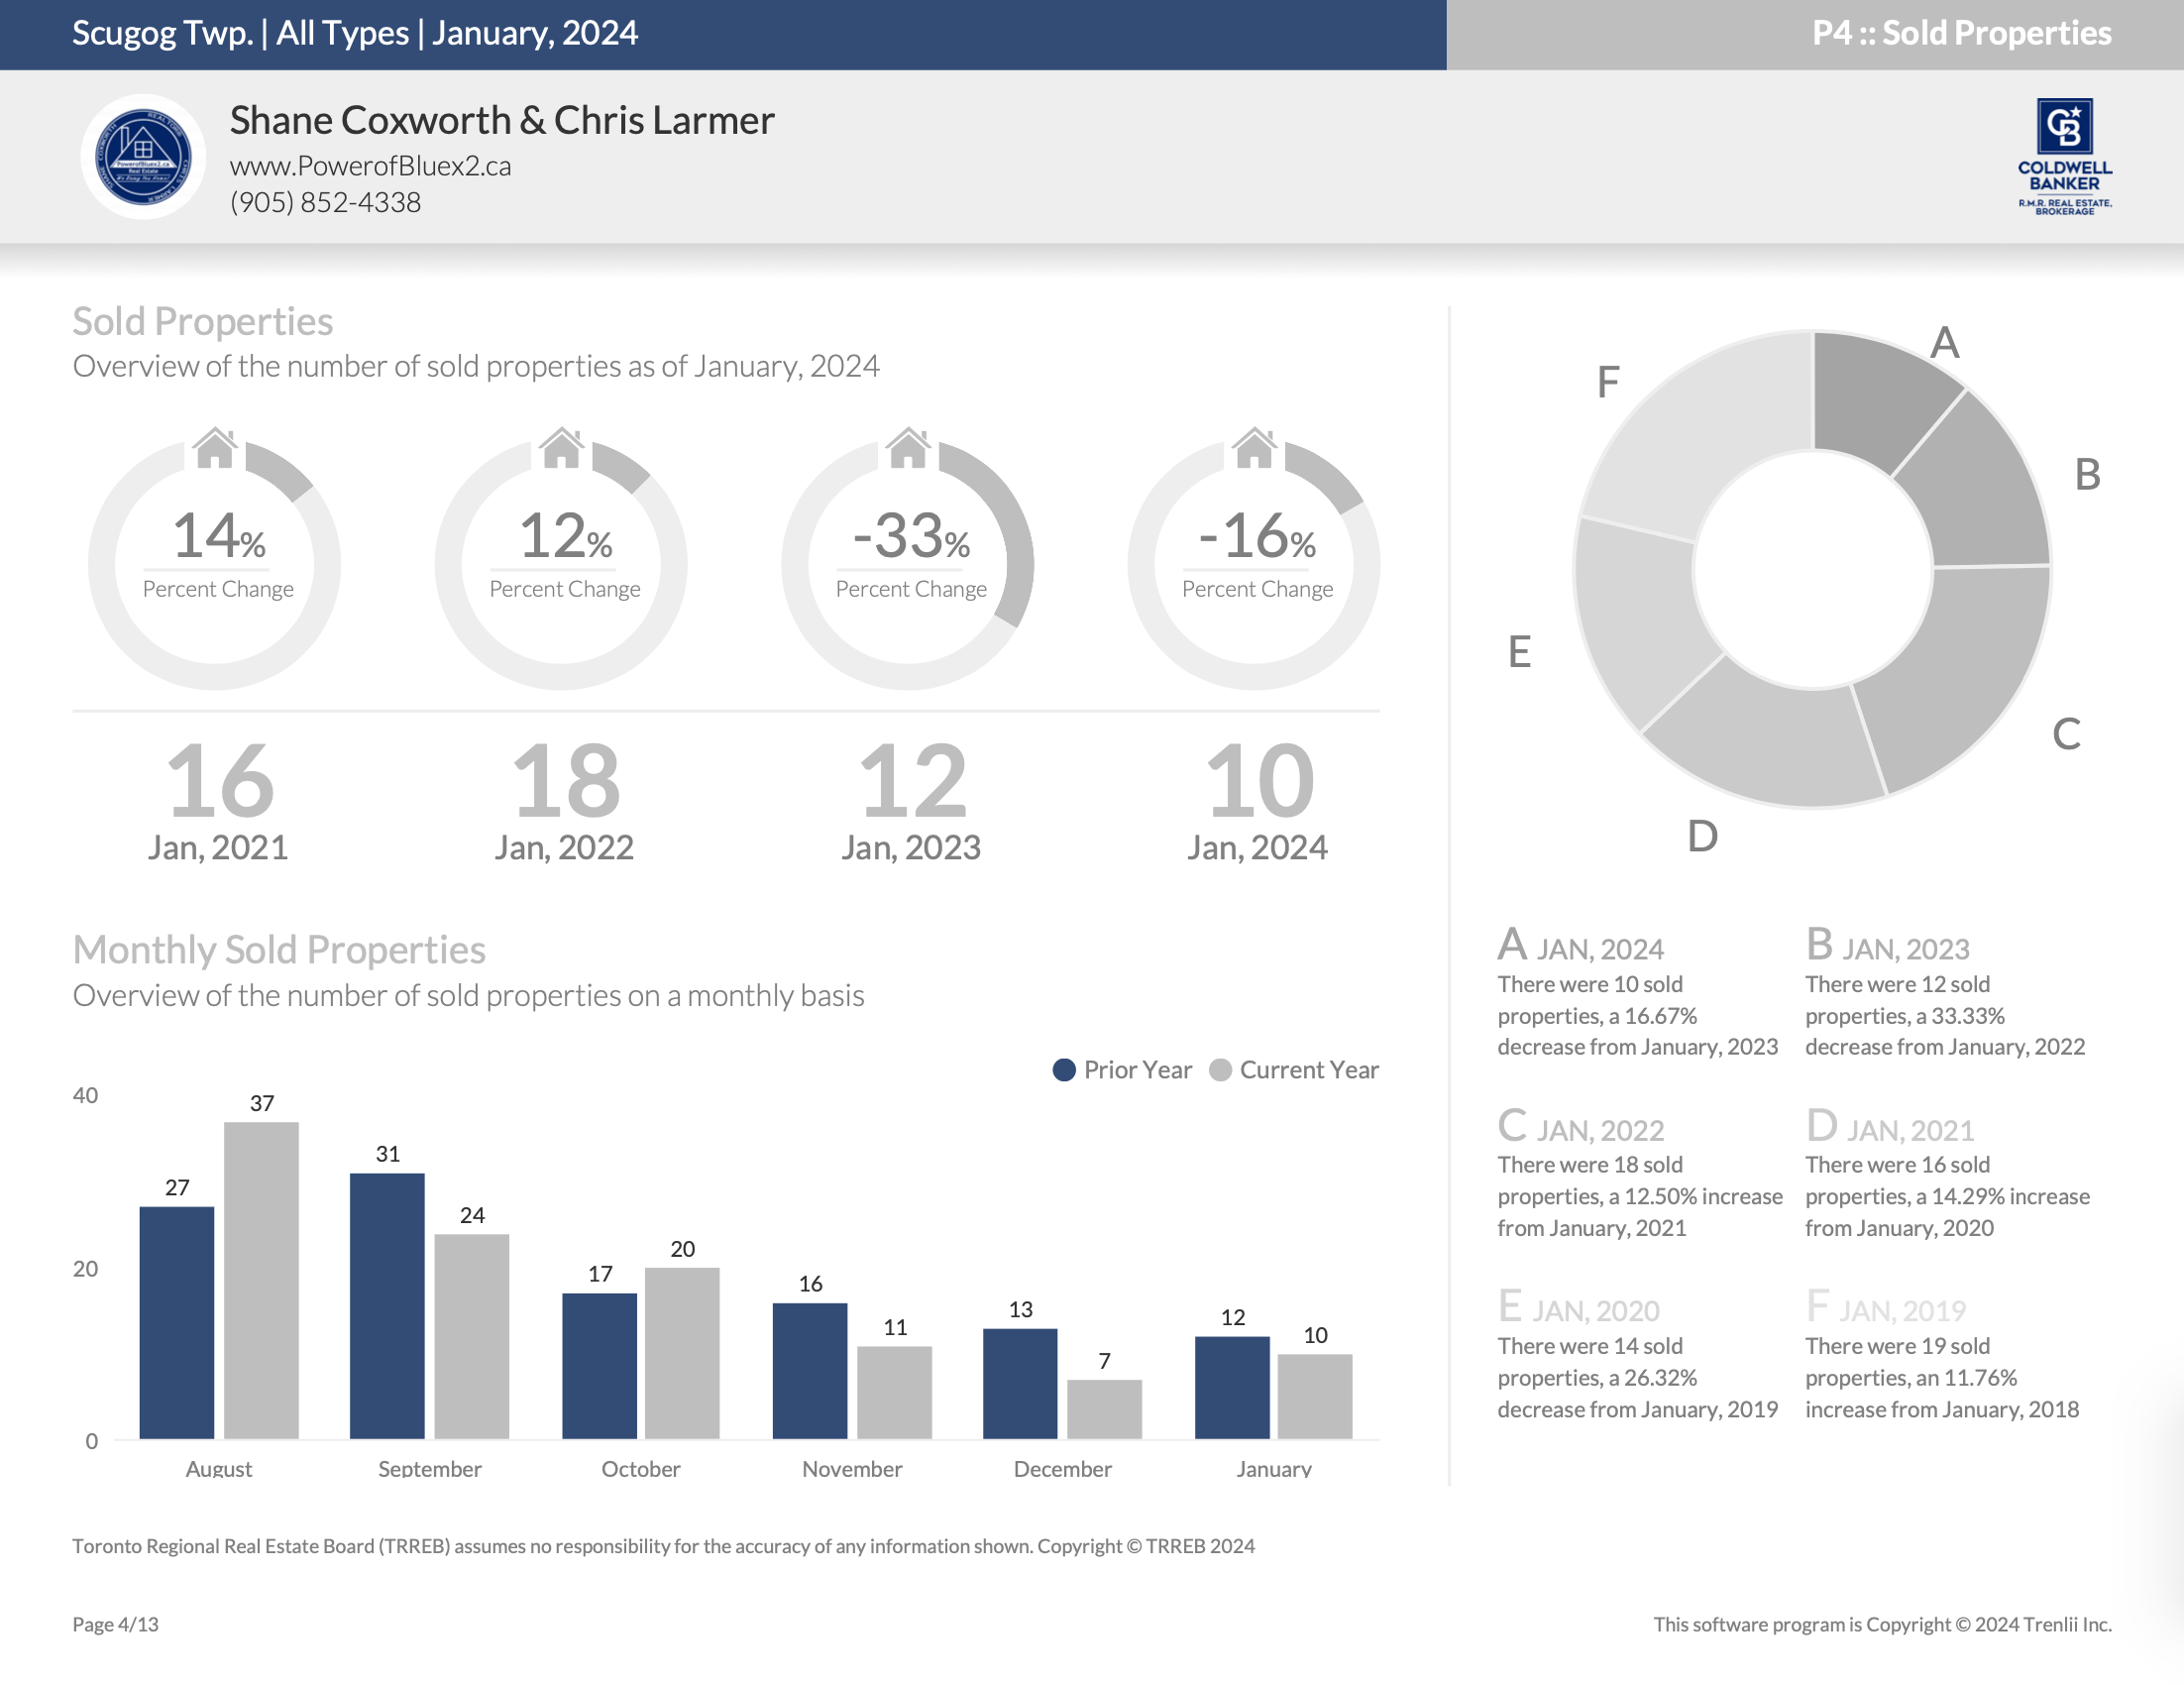
As for property sales, November 2023 saw 11 properties changing hands—a 31.25% decrease from the 16 listings sold in November 2022. Nonetheless, the year-to-date sales volume for 2023 increased to 291, reflecting a 3.19% rise from the 282 transactions in 2022.

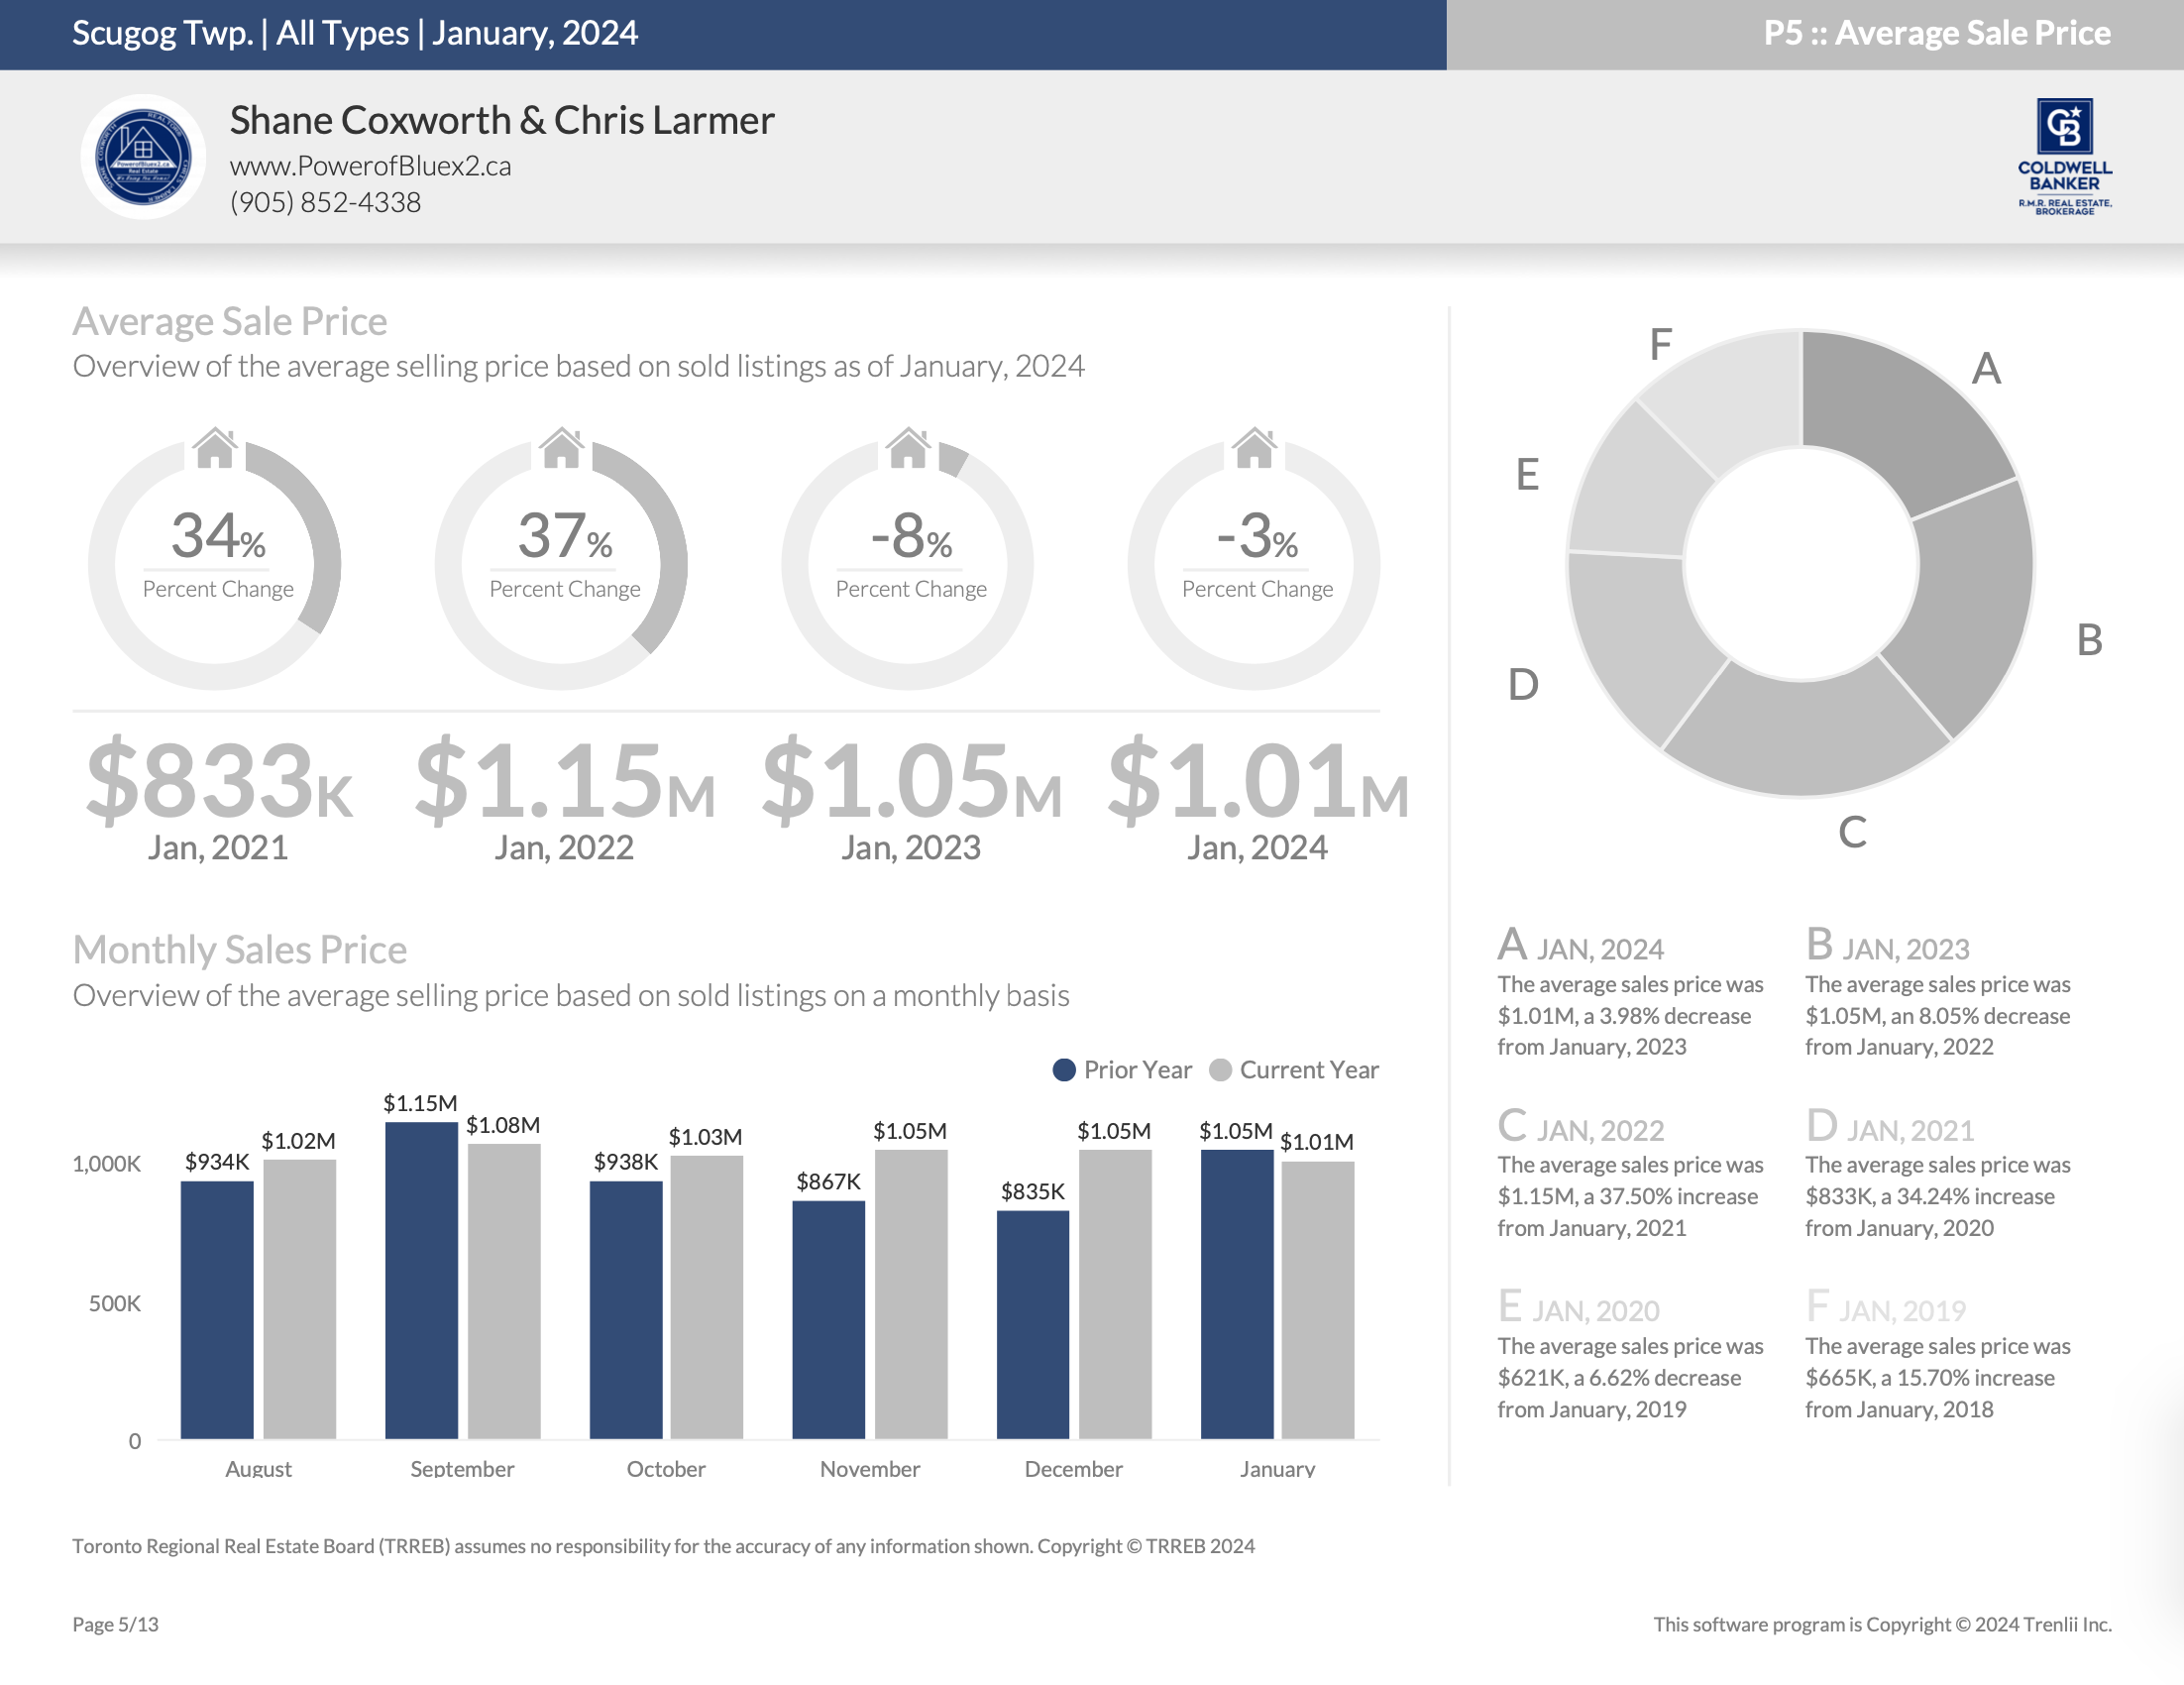
The average sales price in November 2023 surged to $1.05M, marking a 21.18% increase from November 2022’s $867K. However, the year-to-date average sales price for 2023 is $999K, reflecting an 11.56% decrease compared to the $1.13M recorded in 2022.

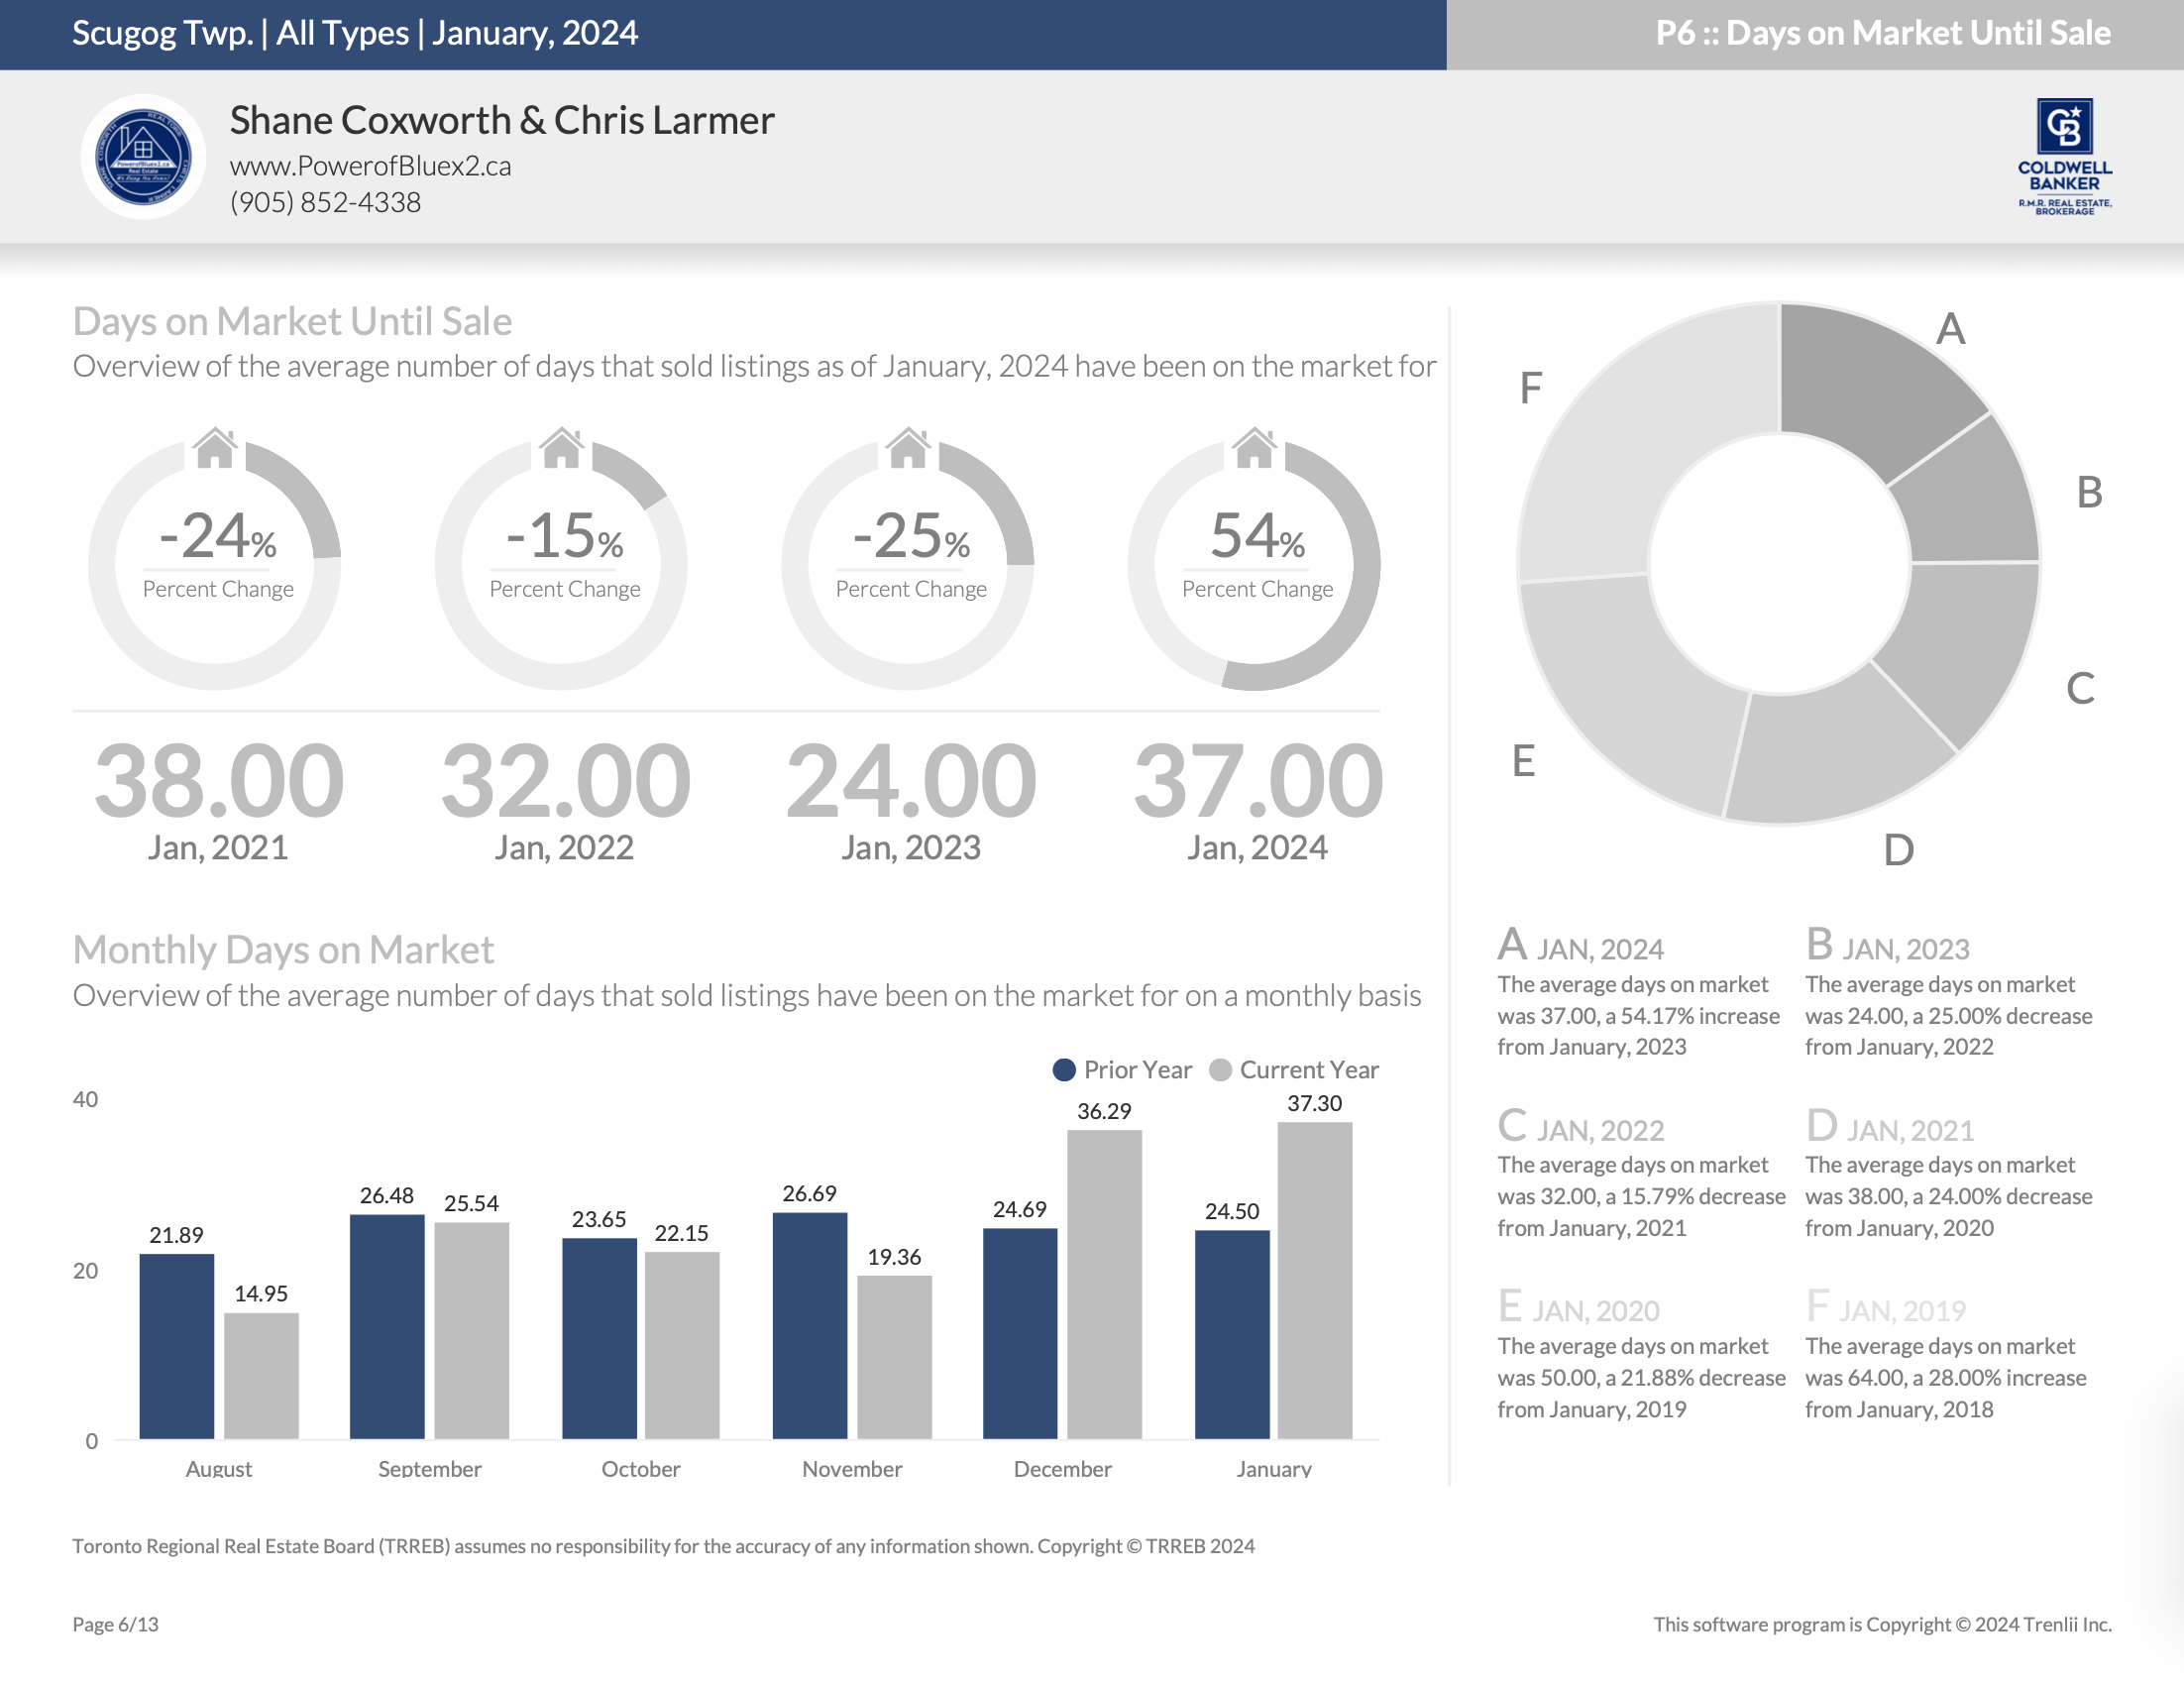
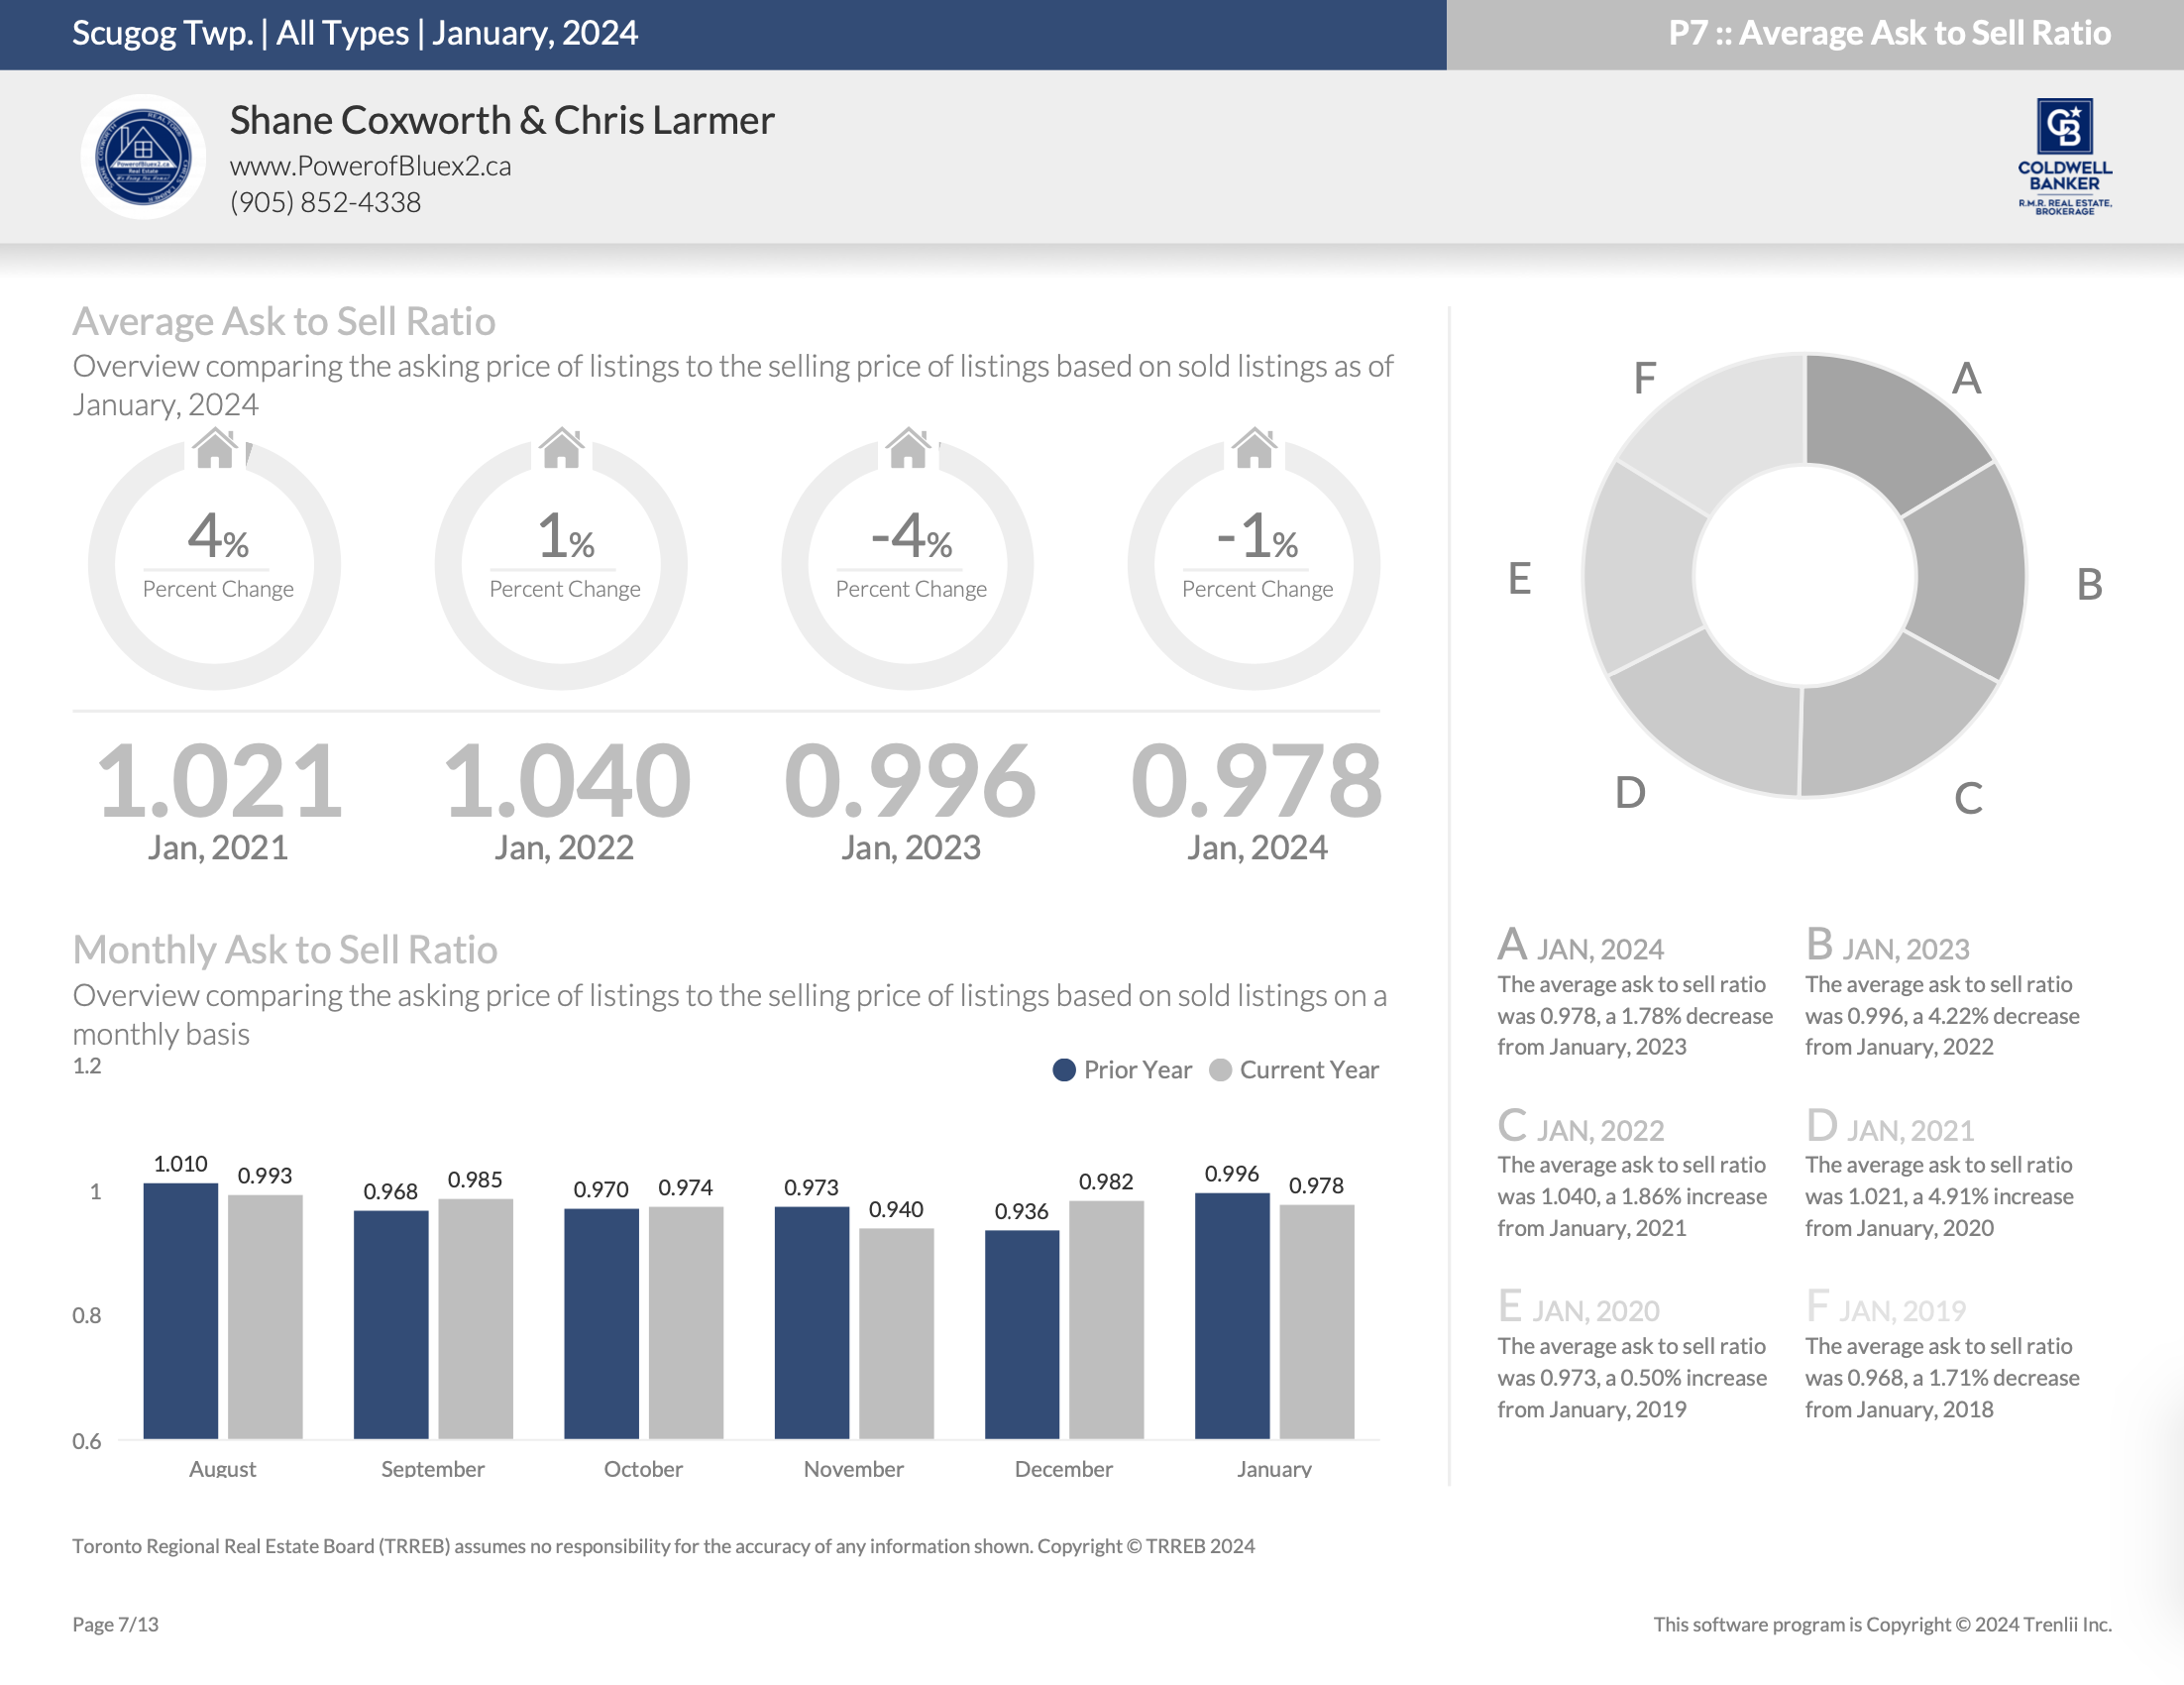
Examining market dynamics, the average ask-to-sell ratio for November 2023 is 0.940, indicating a 3.46% decrease from November 2022’s 0.973 ratio. The year-to-date average ask-to-sell ratio for 2023 is 1.002, showing a 5.25% decrease from the 1.057 ratio in 2022. These figures highlight the evolving trends in both listing and selling dynamics within the real estate market.


 Scugog Housing November 2023


Quick Review

 Scugog Housing November 2023


New Listings – November 2023

 Scugog Housing November 2023


New Listings – Year-To-Date


Average Asking Price – November 2023

 Scugog Housing November 2023


Average Asking Price – Year-to-Date


Number of Properties Sold – November 2023

 Scugog Housing November 2023


Number of Properties Sold – Year-to-Date


Average Sold Price – November 2023

 Scugog Housing November 2023


Average Sold Price – Year-to-Date


Days on Market – November 2023

 Scugog Housing November 2023


Days on Market – Year-to-Date


Average List Price to Sell Price Ratio – November 2023

 Scugog Housing November 2023


Average List Price to Sell Price Ratio – Year-to-Date


*Information is believed to be accurate at time of posting but is not guaranteed to be correct 

Not intended as a solicitation if your property is already listed by another broker. Affiliated real estate agents are independent contractor sales associates, not employees. ©2021 Coldwell Banker. All Rights Reserved. Coldwell Banker and the Coldwell Banker logos are trademarks of Coldwell Banker Real Estate LLC. The Coldwell Banker® System is comprised of company owned offices which are owned by a subsidiary of Realogy Brokerage Group LLC and franchised offices which are independently owned and operated. The Coldwell Banker System fully supports the principles of the Fair Housing Act and the Equal Opportunity Act.


Click below for more reports

Durham Region

Township of Uxbridge

Township Brock

City of Kawartha Lakes


Neighbour News

December 7, 2023

Brock Housing November 2023

Brock Housing November 2023

Township of Brock

Housing Market Report for November 2023

Here is the Township of Brock  Housing November 2023 report (all housing types), with reports from the Canadian Real Estate AssociationToronto Regional Real Estate Board and the Durham Association of REALTORS®  included.

This housing report for Township of Brock includes the number of new listings, average list price, number of properties sold, average selling price, average days on market and average asking price to selling price ratio for all property types within the Township of Brock.


Scroll to the bottom for links to take you to the housing market reports for Durham, Uxbridge, Scugog and the Kawartha Lakes.


CREA HOUSING MARKET REPORT – NOVEMBER 2023


From Toronto Regional Real Estate Board


Toronto Regional Real Estate Board – Market Stats At A Glance – November 2023


Read the Toronto Regional Real Estate Board  Market Watch Report 


Durham REALTORS® Report November 2023 Housing Statistics


Read the Durham Association of REALTORS® FULL Real Estate Report


Township of Brock Full Report

*Some values may vary slightly based on the exact date and time the reports were generated.


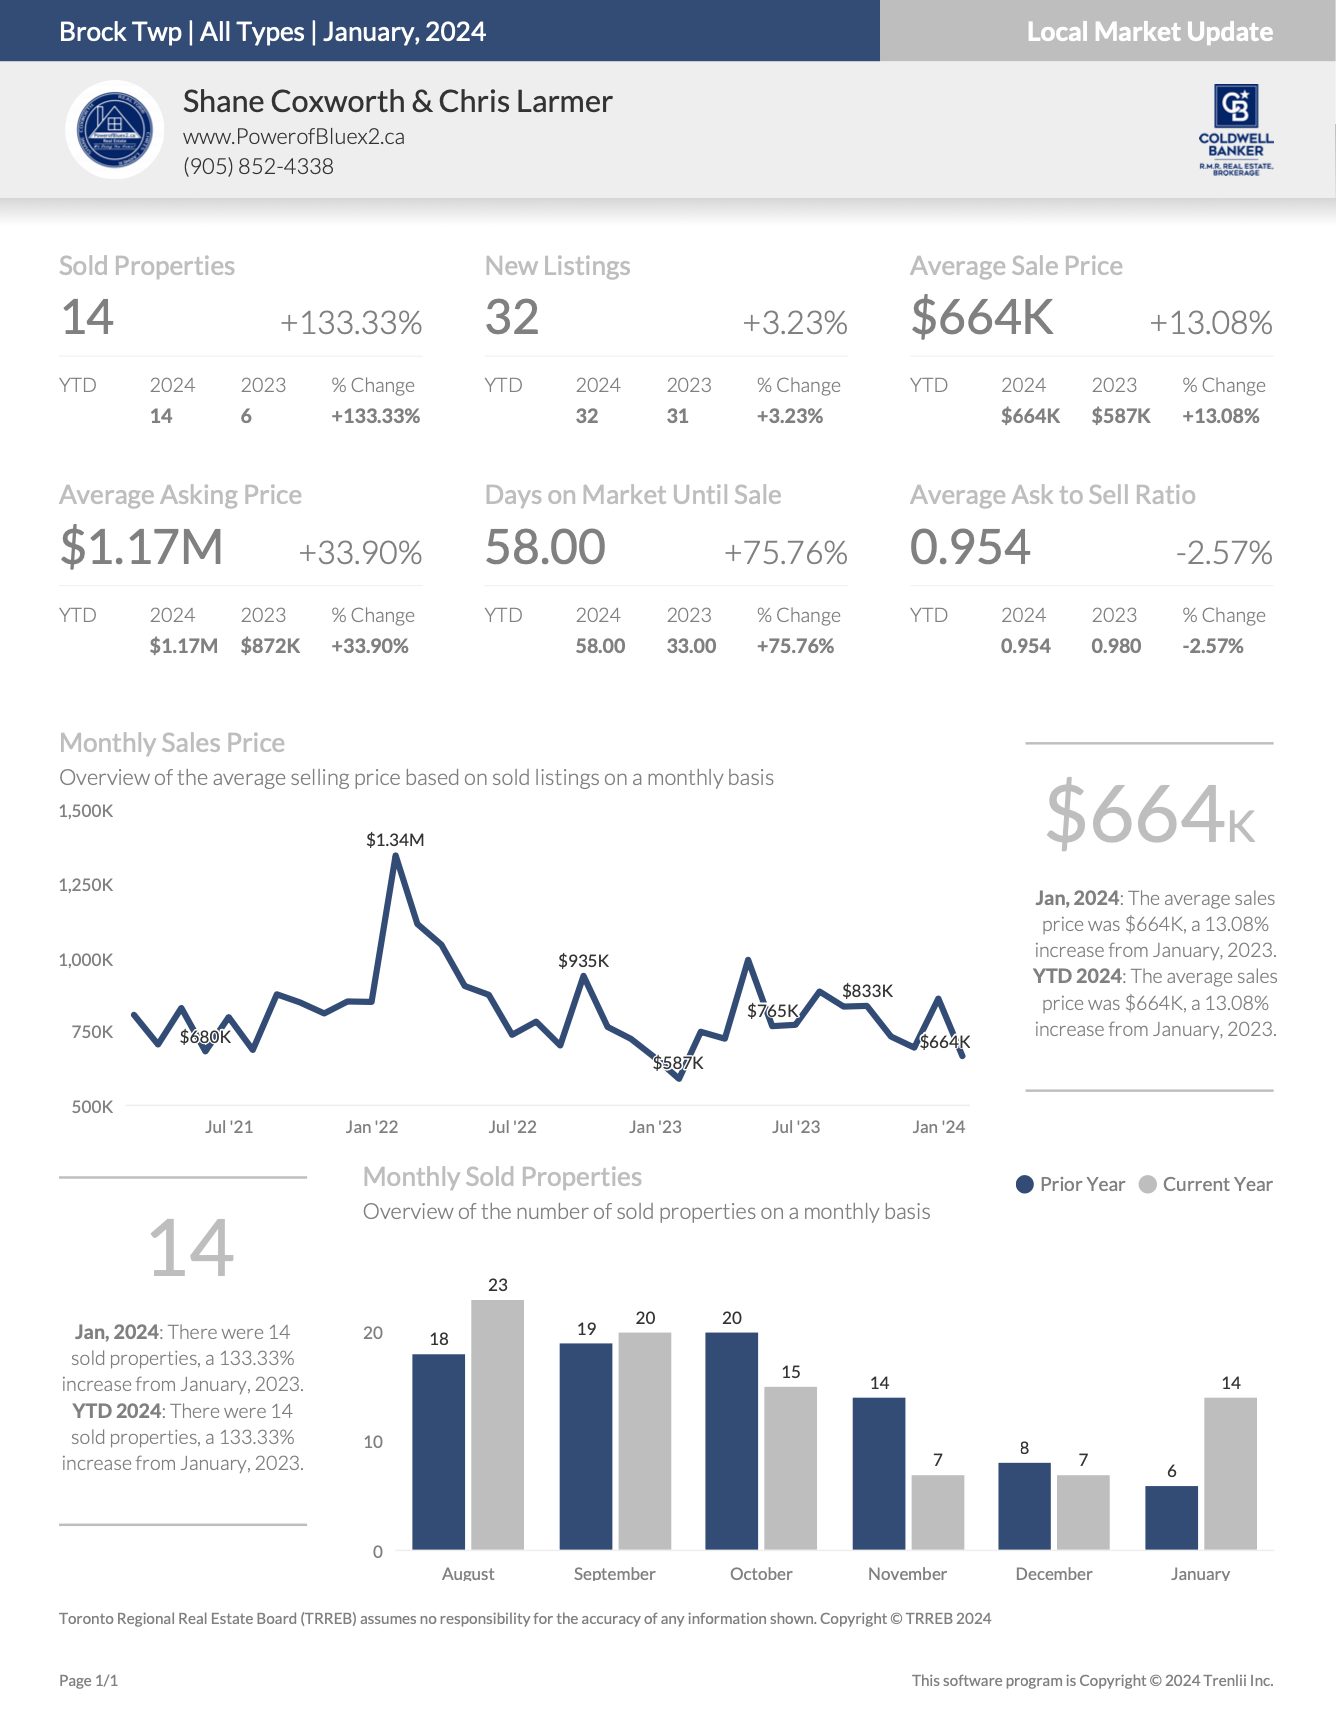
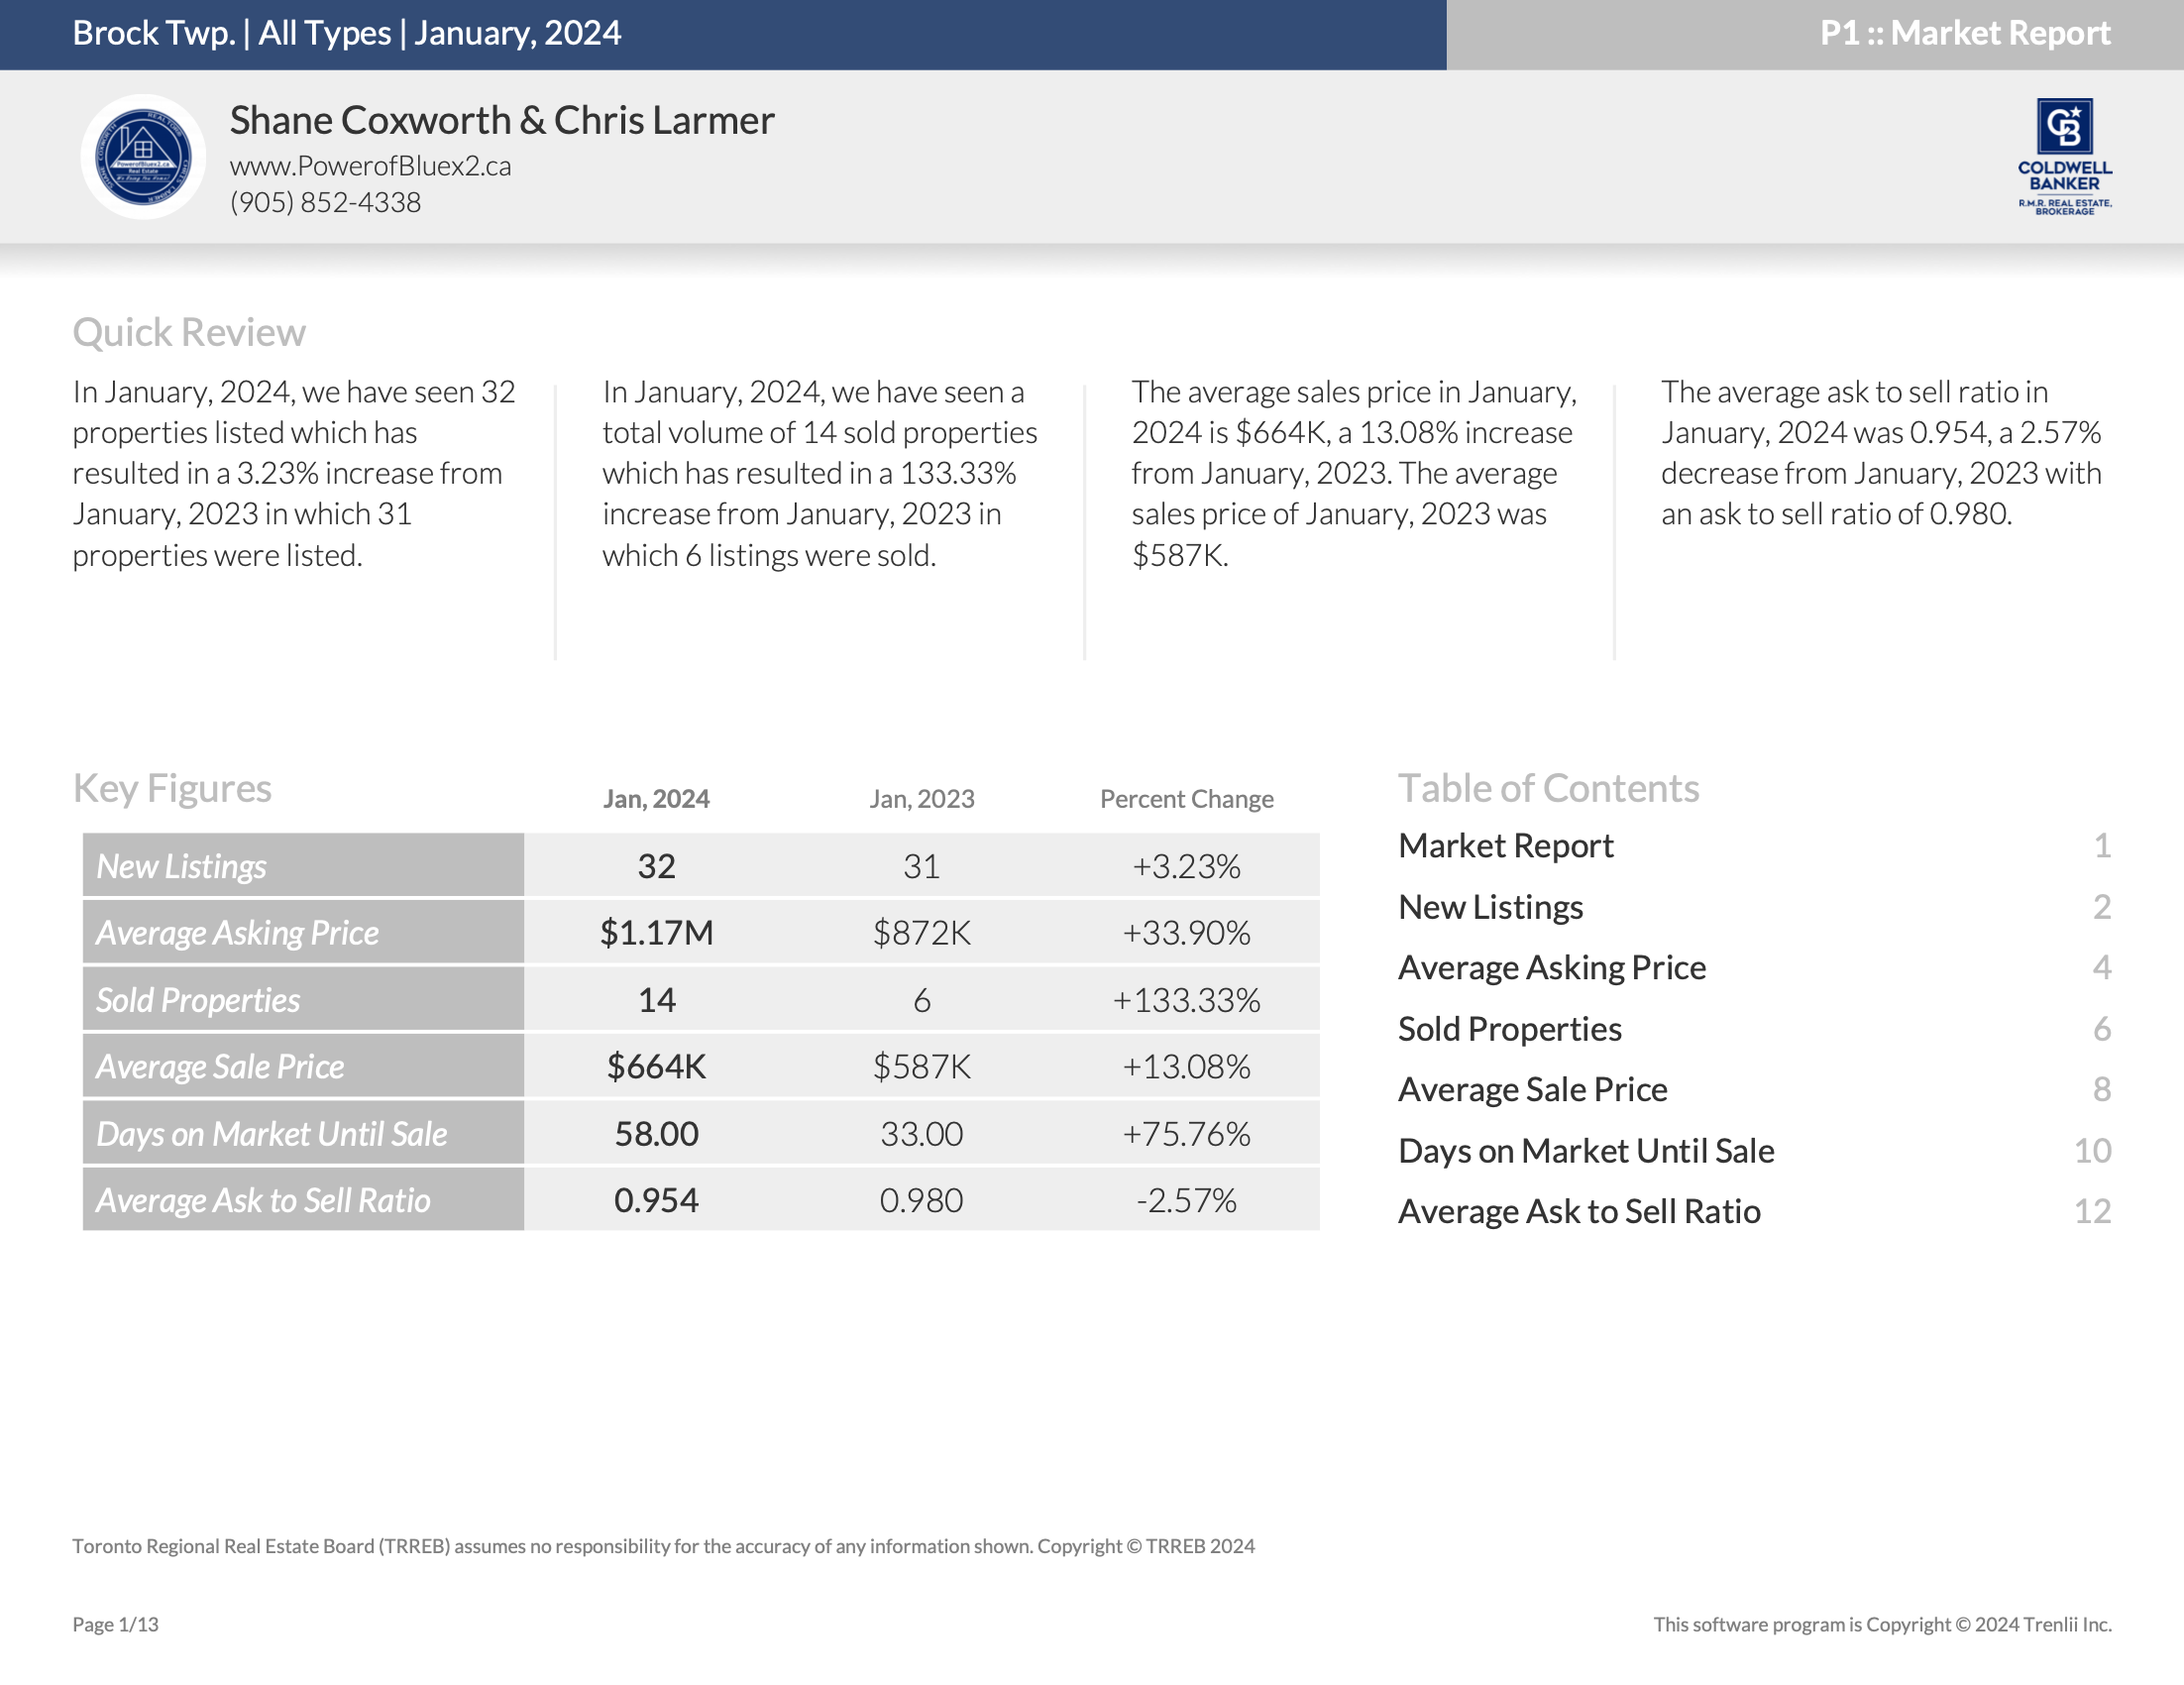
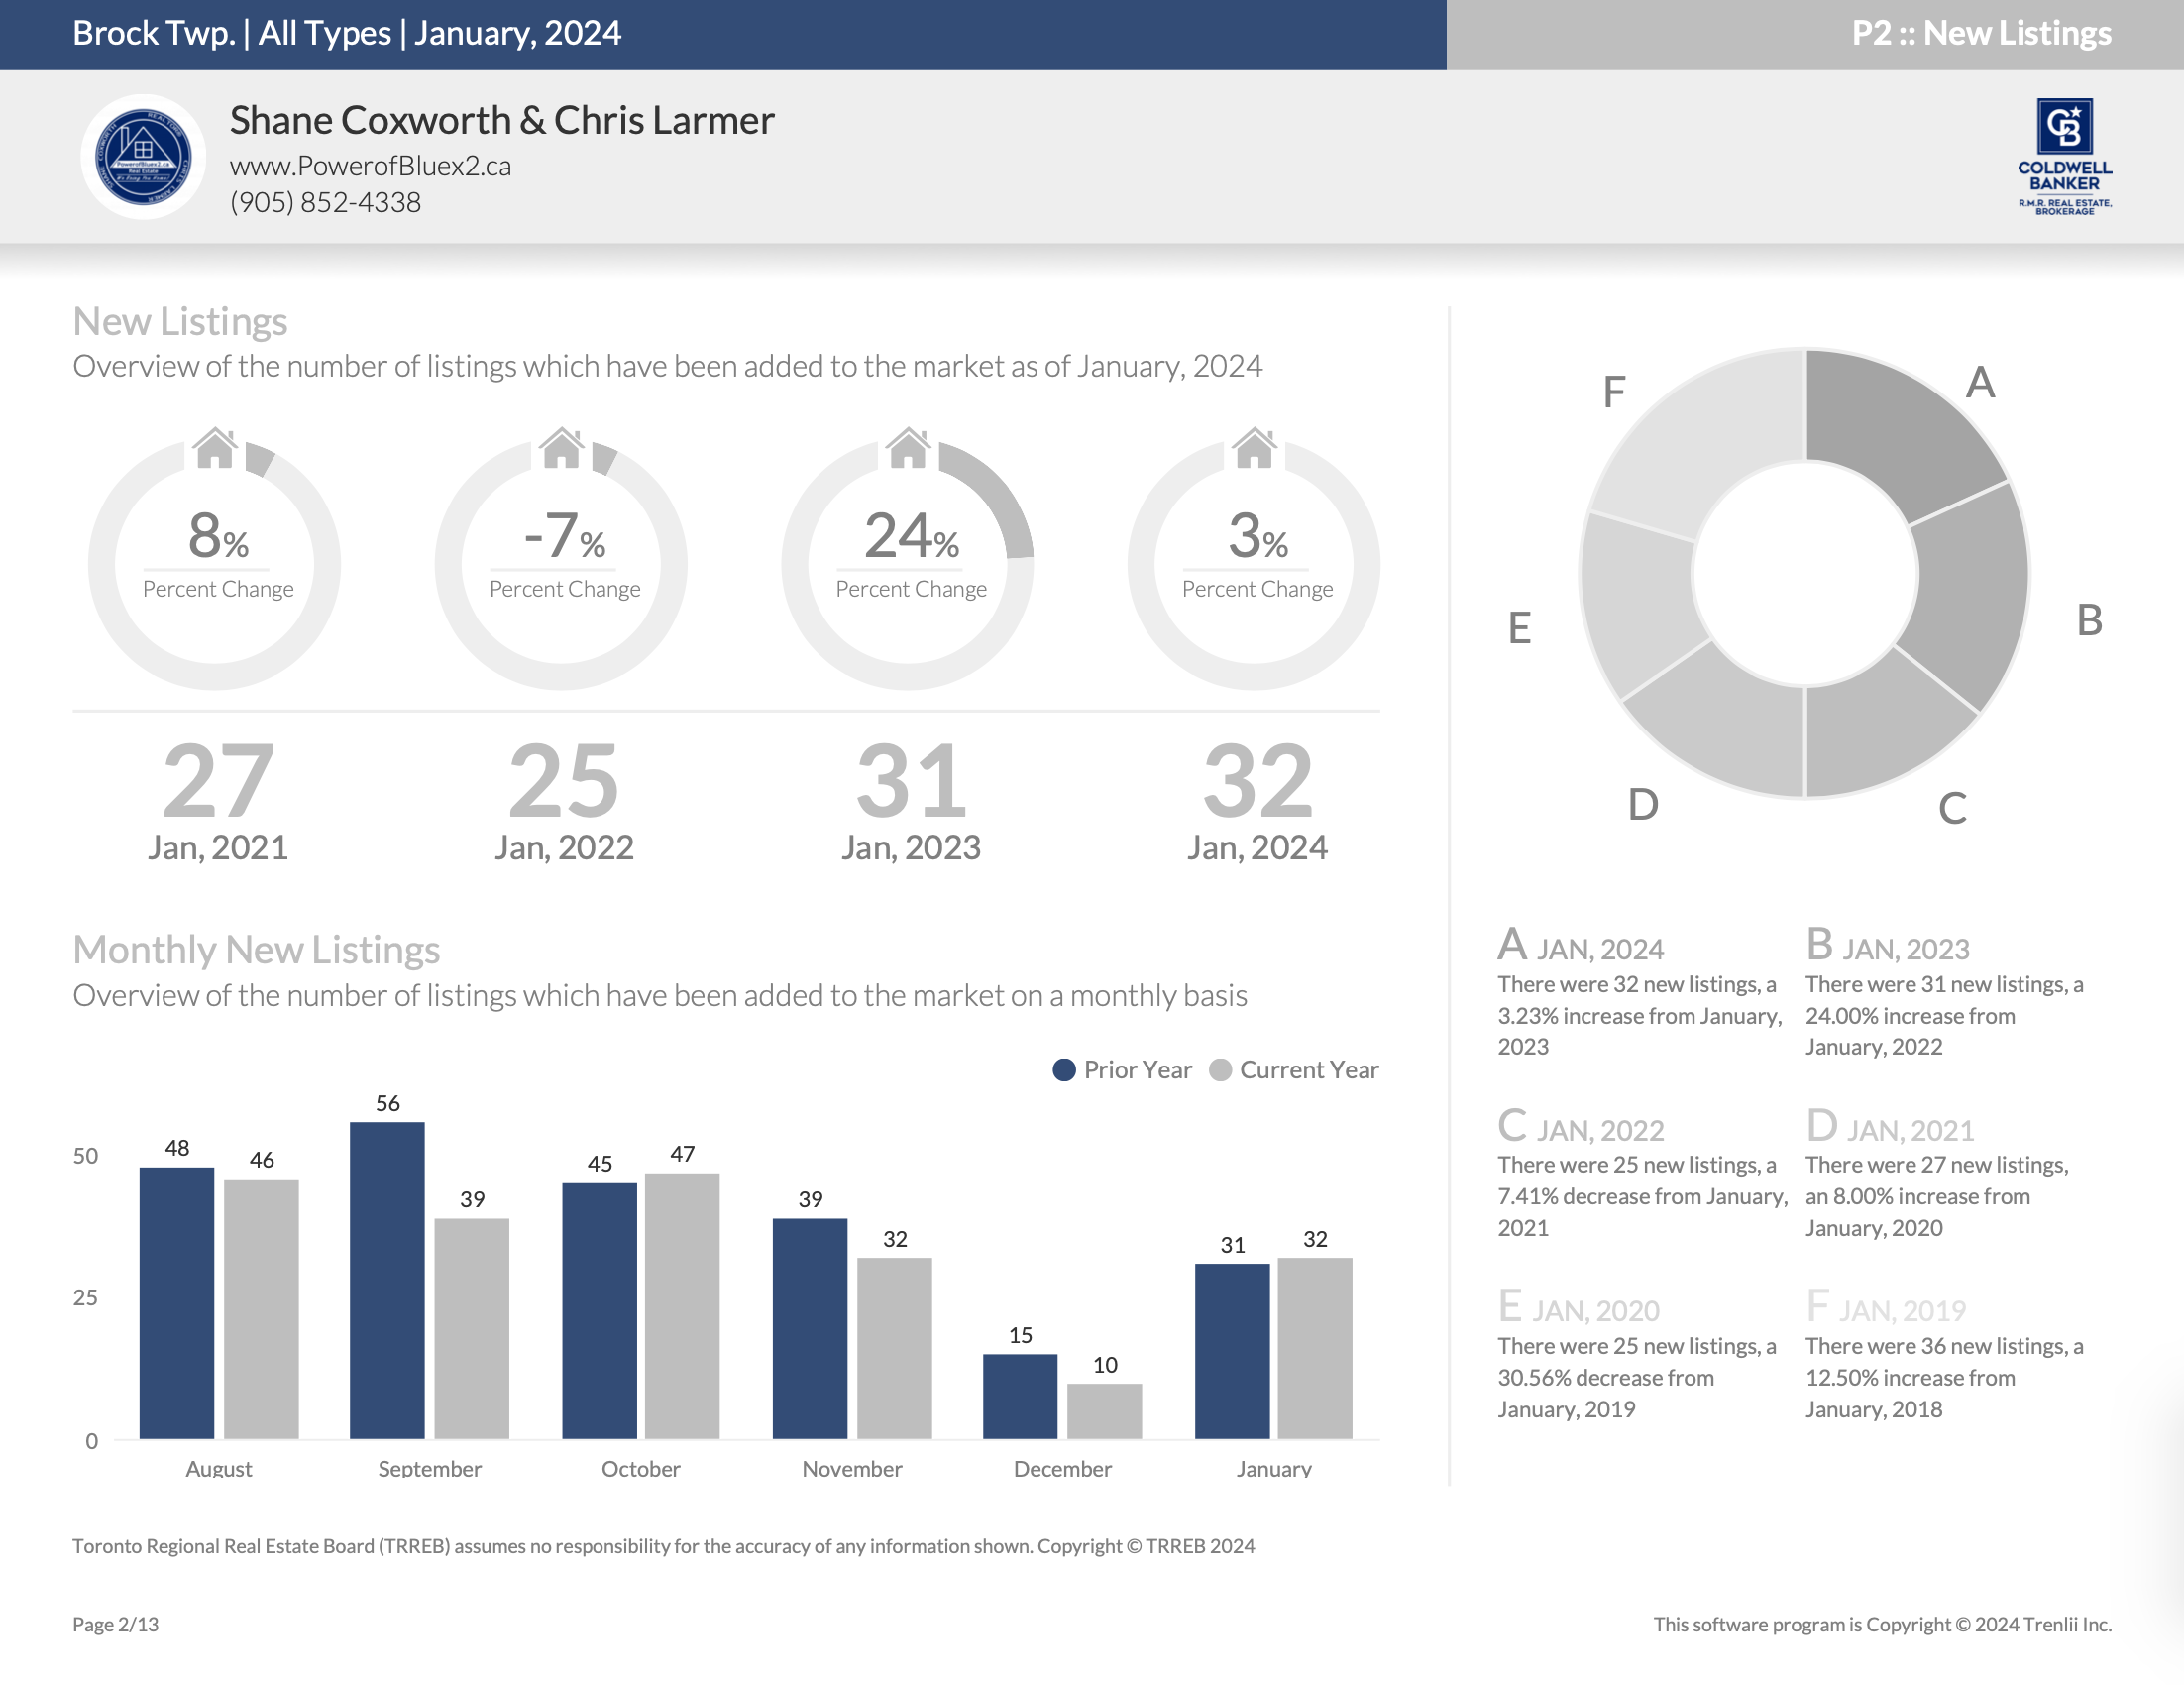
In November 2023, the real estate market witnessed a shift with 32 properties listed, marking a 17.95% decrease from the 39 properties listed in November 2022. The year-to-date volume for 2023 is 483, reflecting an 11.05% decrease from the 543 recorded in 2022.

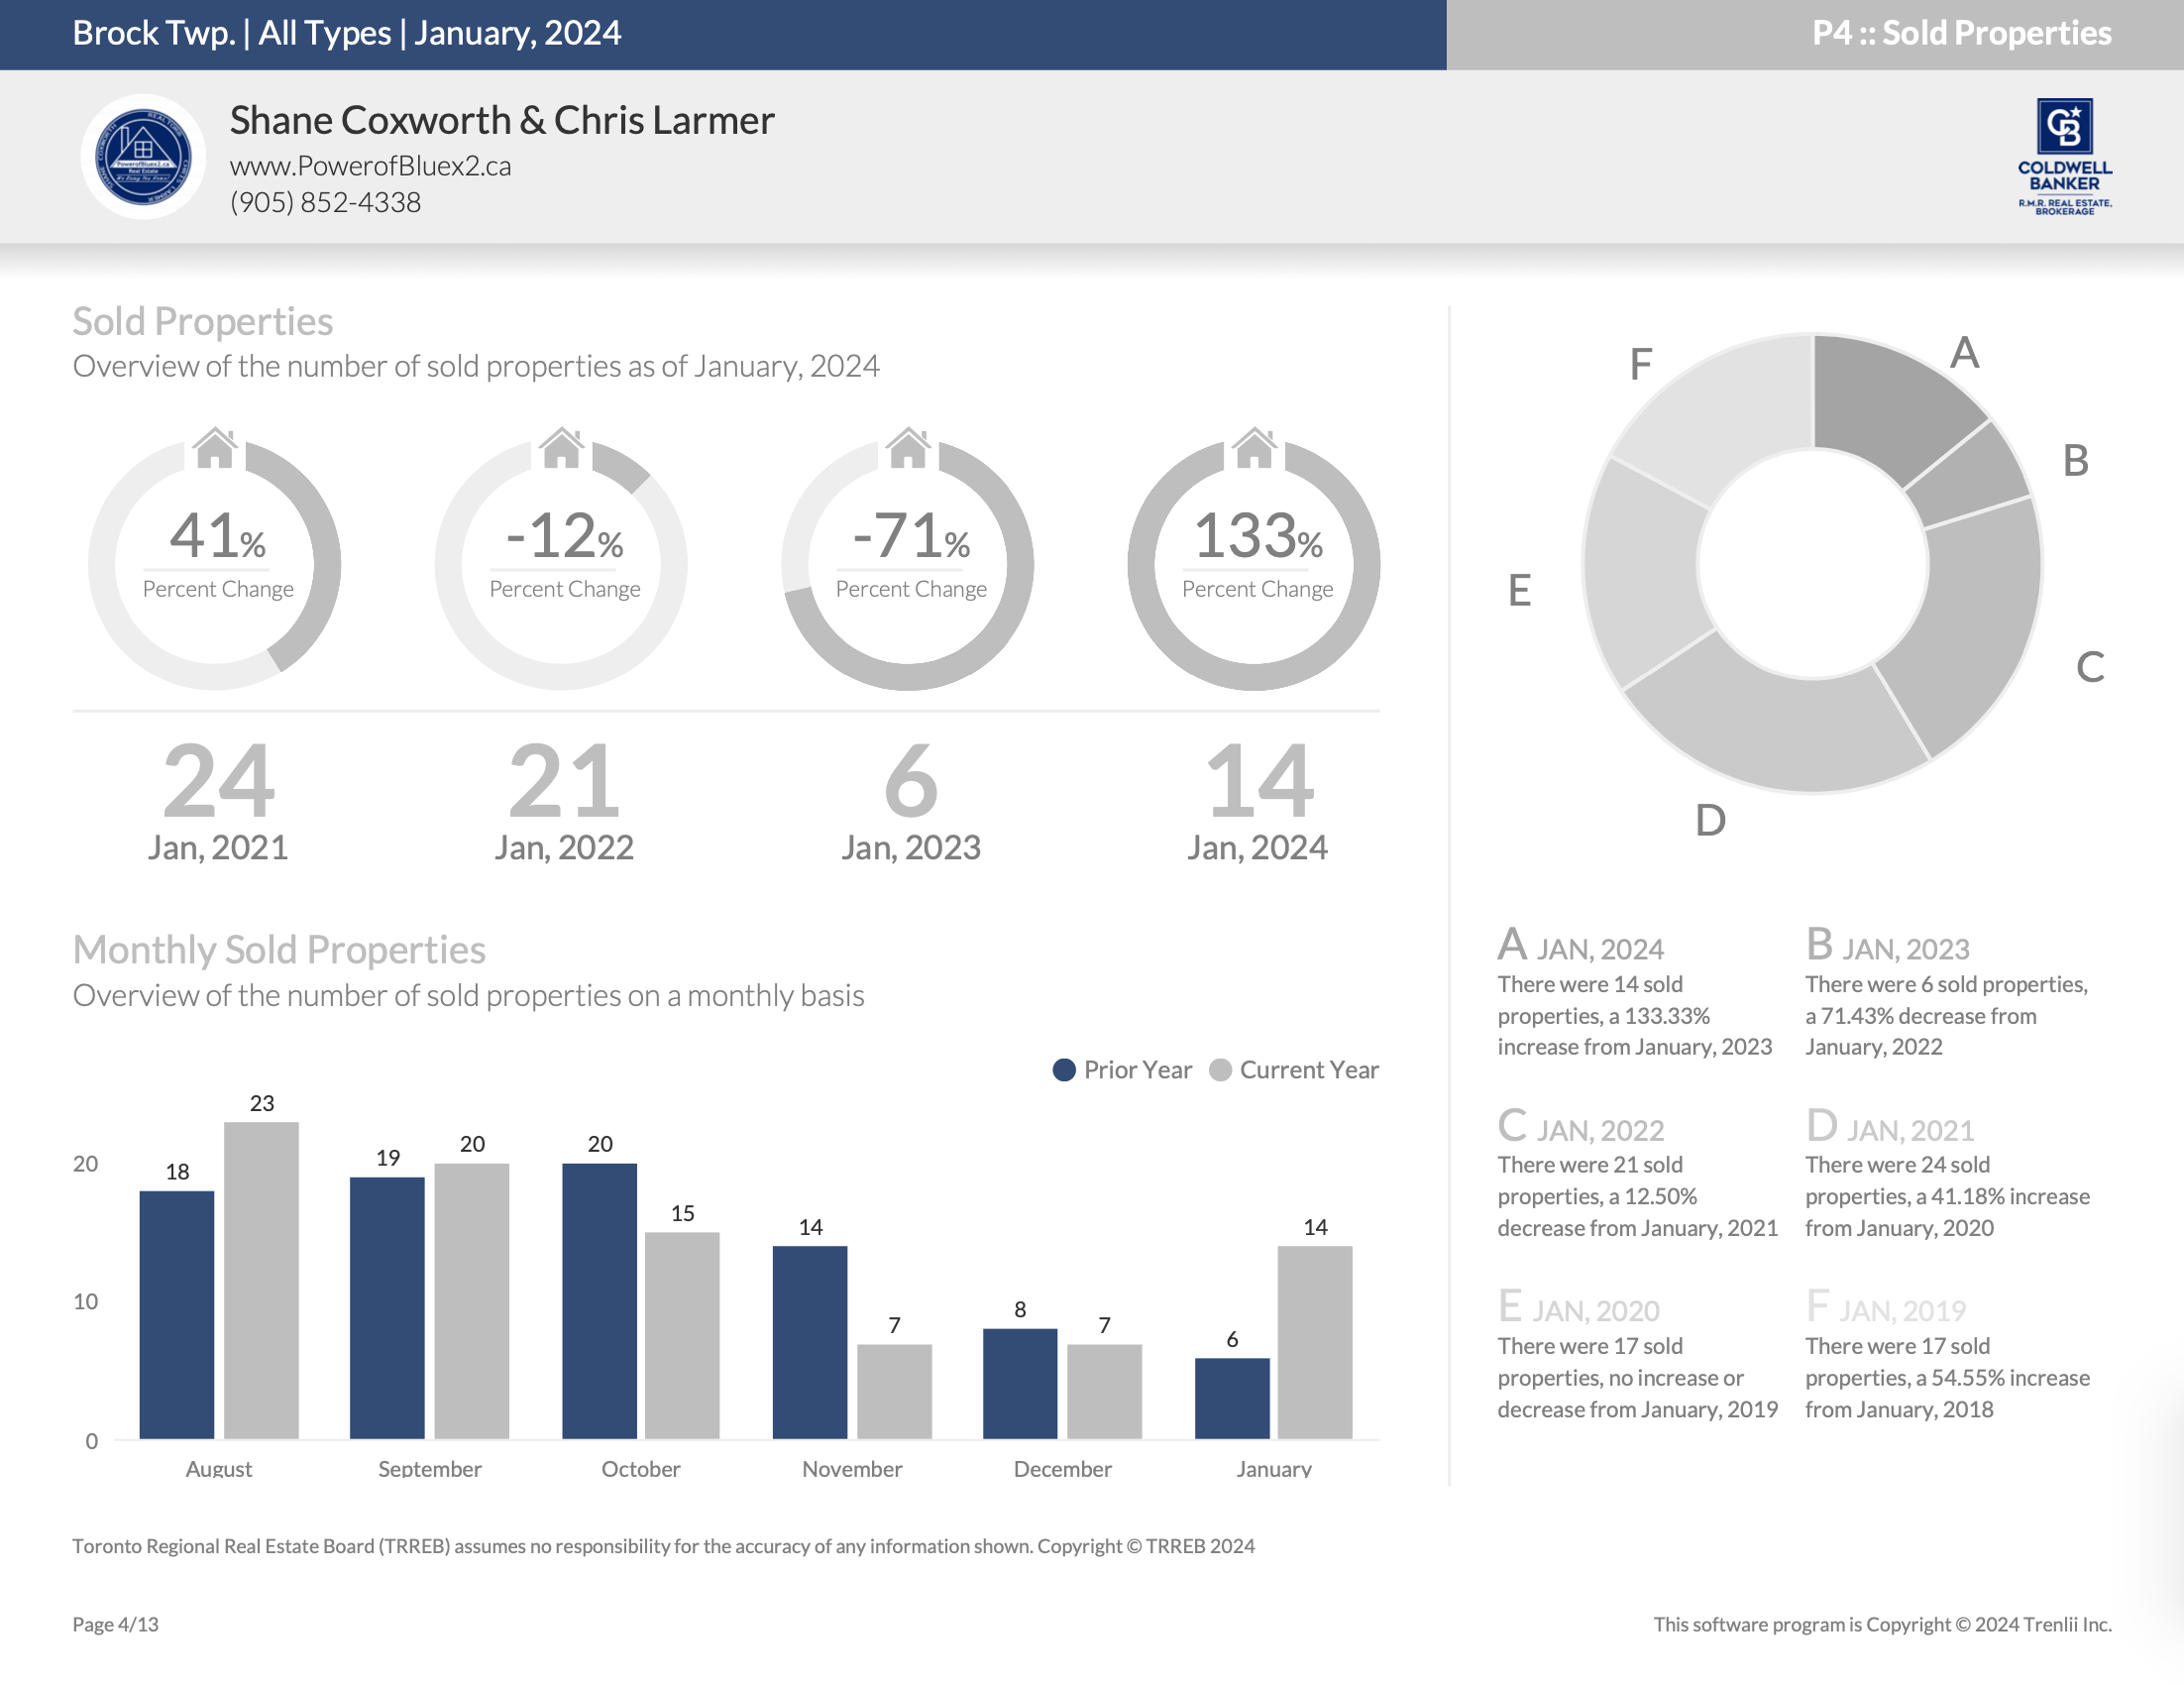
As for property sales, November 2023 saw 7 properties changing hands—a 50.00% decrease from the 14 listings sold in November 2022. The year-to-date sales volume for 2023 is 196, showing a 13.27% decline from the 226 transactions in 2022.

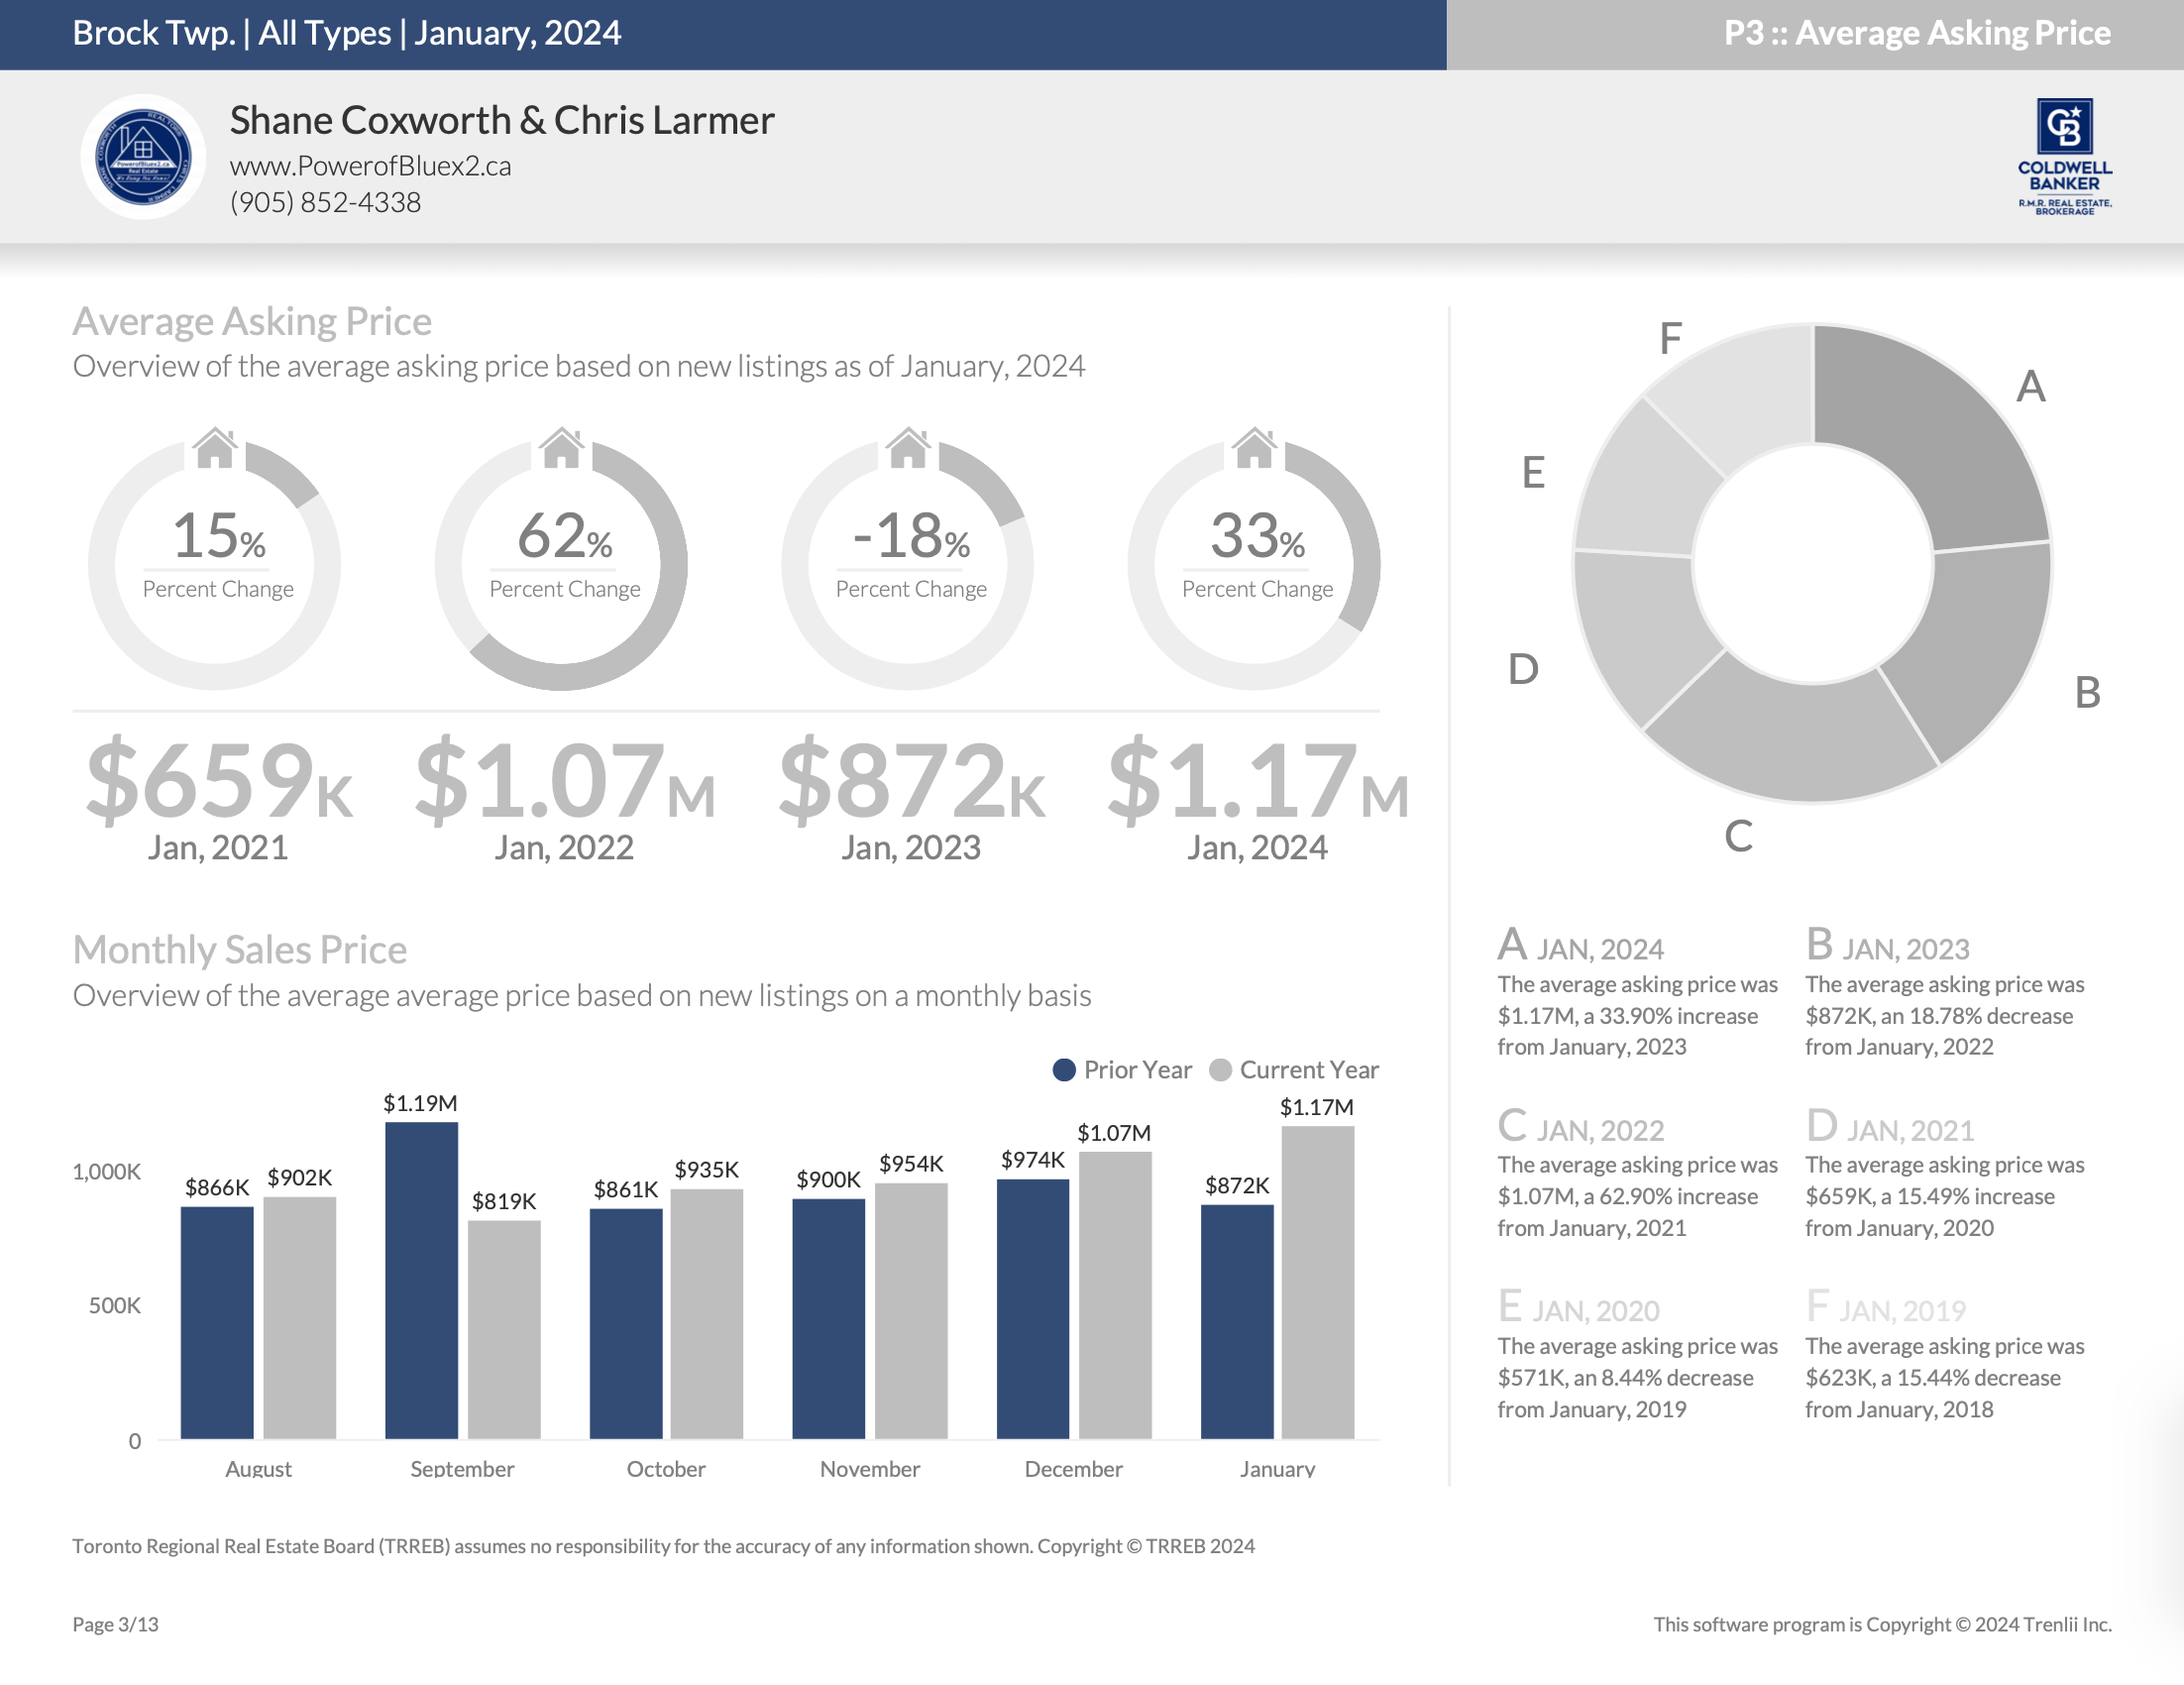
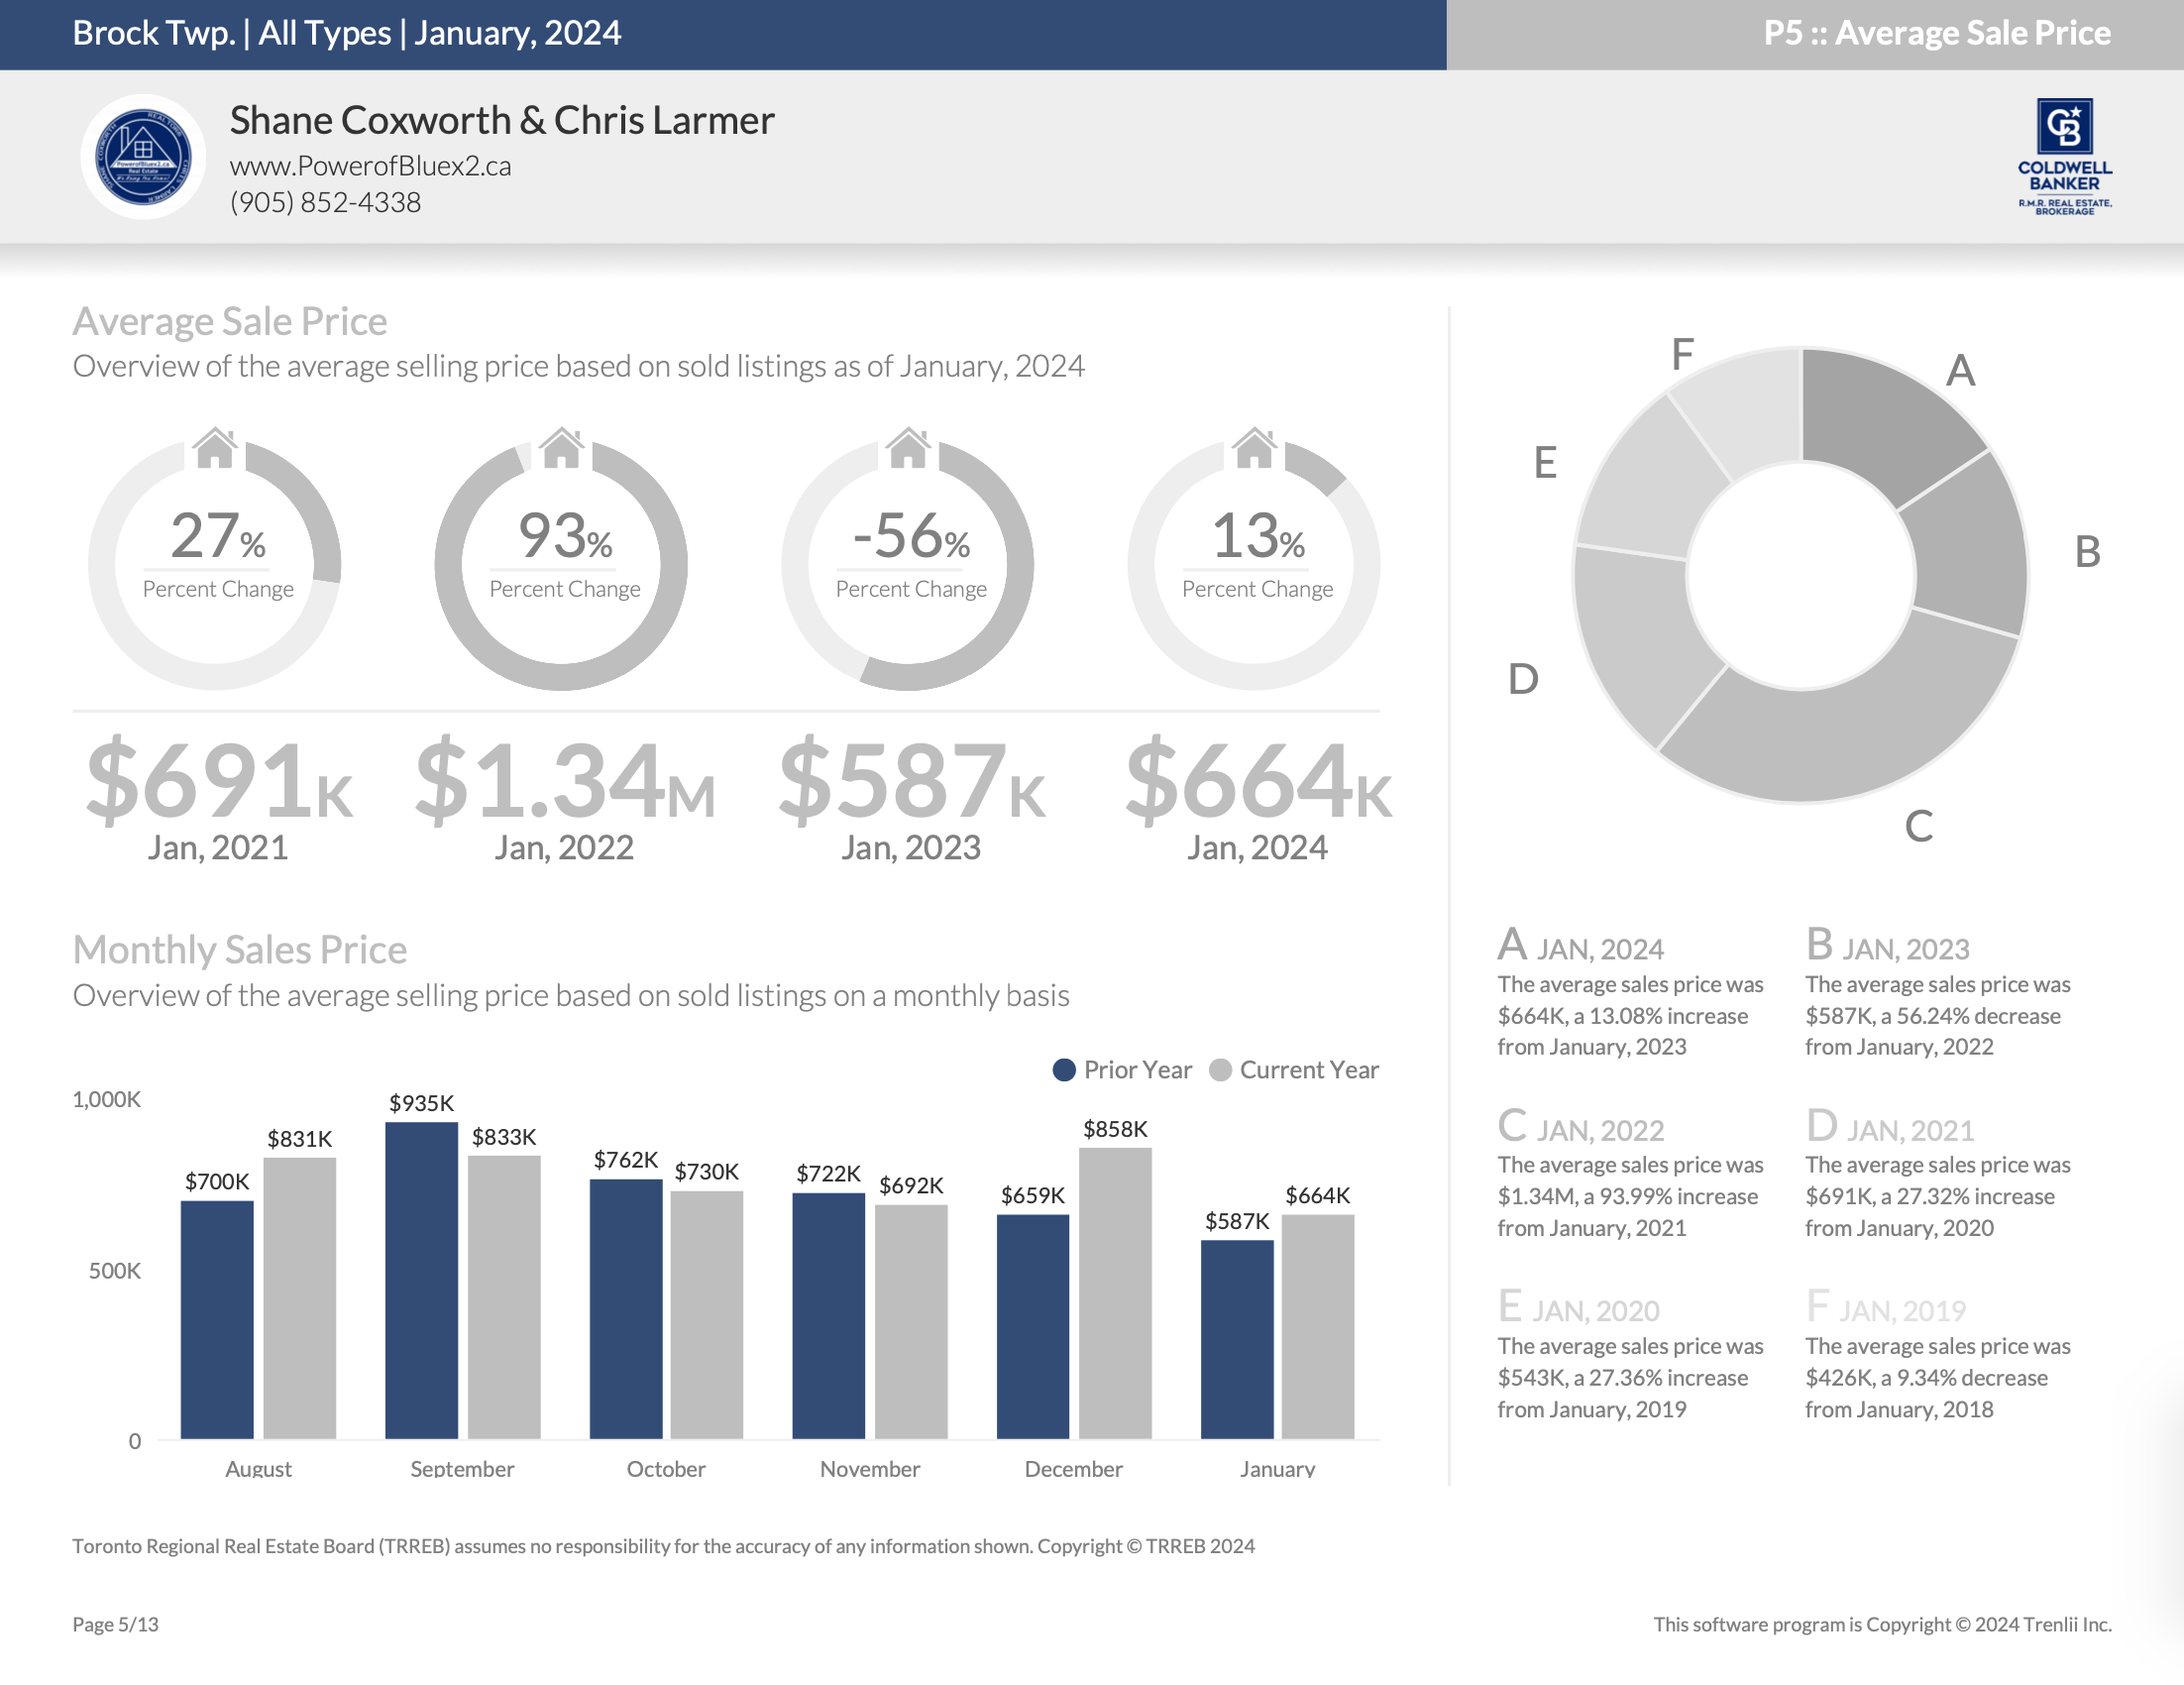
The average sales price in November 2023 is $692K, indicating a 4.12% decrease from November 2022’s $722K. The year-to-date average sales price for 2023 is $798K, reflecting a 14.09% decrease compared to the $928K recorded in 2022.

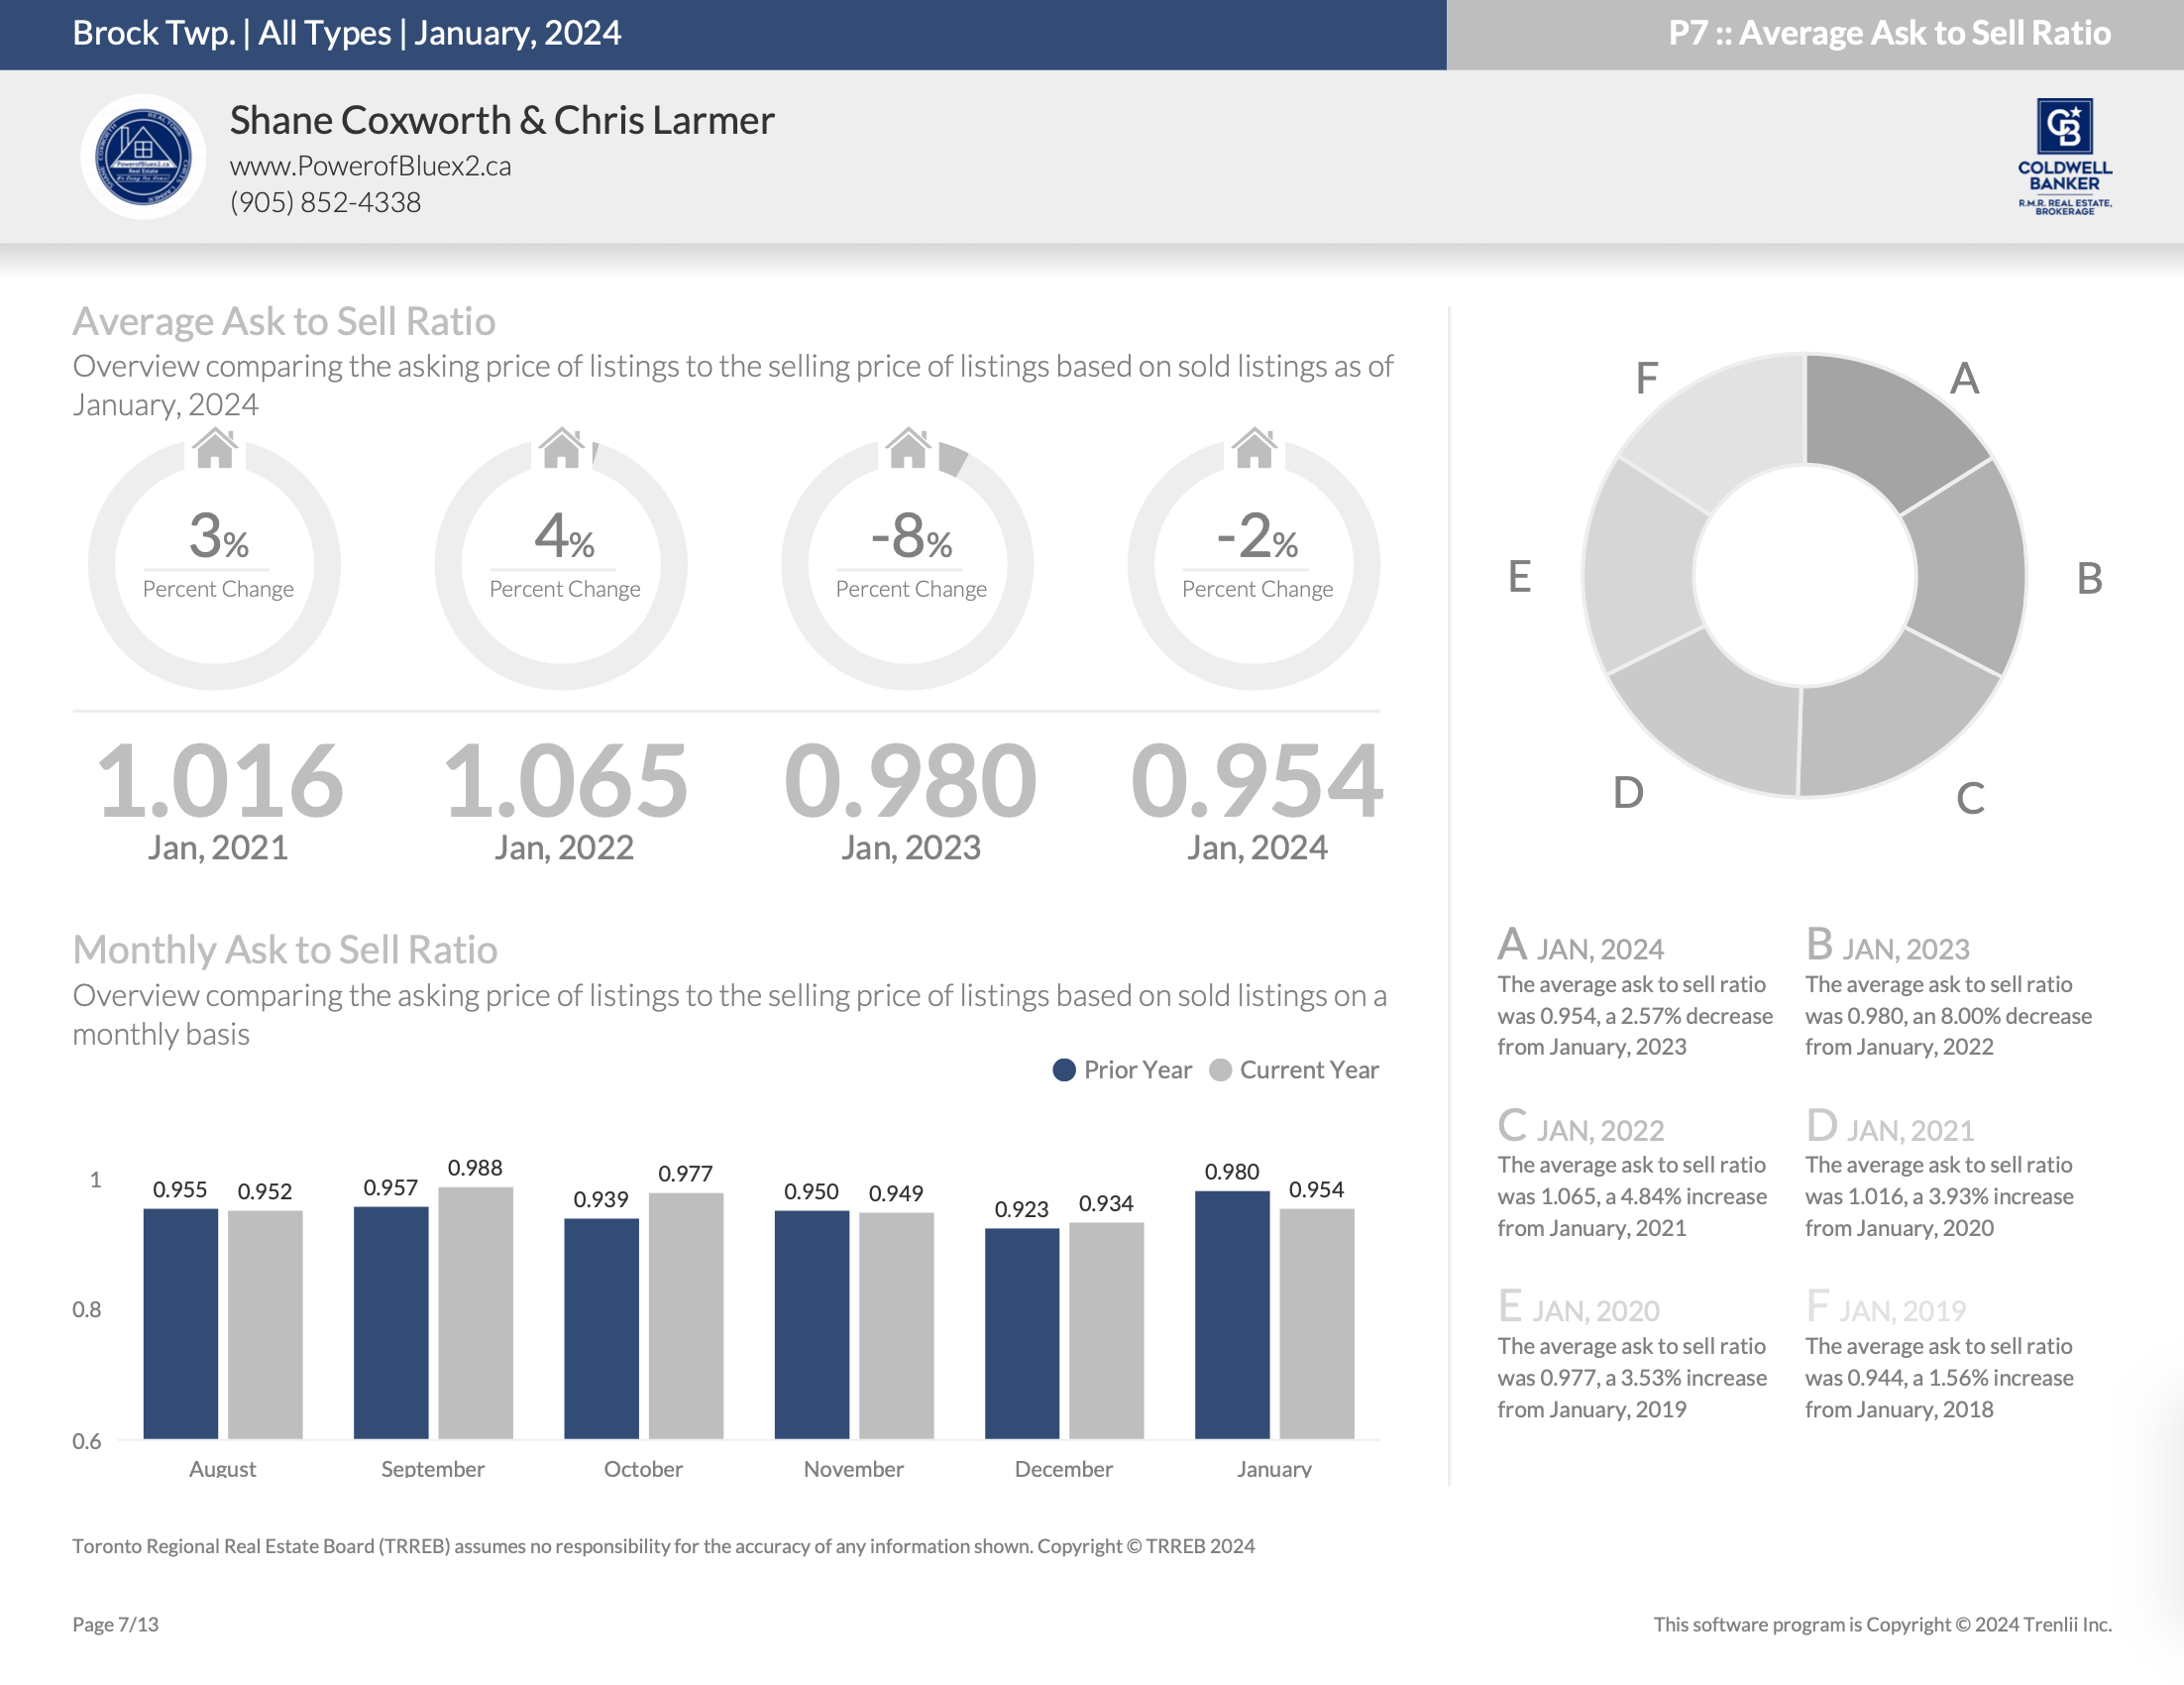
Examining market dynamics, the average ask-to-sell ratio for November 2023 is 0.949, a slight 0.09% decrease from November 2022’s 0.950 ratio. The year-to-date average ask-to-sell ratio for 2023 is 0.970, showing a 6.09% decrease from the 1.033 ratio in 2022. These figures underscore the evolving trends in both listing and selling dynamics within the real estate market.


Brock Housing November 2023


Quick Review

Brock Housing November 2023


New Listings – November 2023

Brock Housing November 2023


New Listings – Year-To-Date


Average Asking Price – November 2023

Brock Housing November 2023


Average Asking Price – Year-to-Date


Number of Properties Sold – November 2023

Brock Housing November 2023


Number of Properties Sold – Year-to-Date


Average Sold Price – November 2023

Brock Housing November 2023


Average Sold Price – Year-to-Date


Days on Market – November 2023

Brock Housing November 2023


Days on Market – Year-to-Date


Average List Price to Sell Price Ratio – November 2023

Brock Housing November 2023


Average List Price to Sell Price Ratio – Year-to-Date


*Information is believed to be accurate at time of posting but is not guaranteed to be correct 

Not intended as a solicitation if your property is already listed by another broker. Affiliated real estate agents are independent contractor sales associates, not employees. ©2021 Coldwell Banker. All Rights Reserved. Coldwell Banker and the Coldwell Banker logos are trademarks of Coldwell Banker Real Estate LLC. The Coldwell Banker® System is comprised of company owned offices which are owned by a subsidiary of Realogy Brokerage Group LLC and franchised offices which are independently owned and operated. The Coldwell Banker System fully supports the principles of the Fair Housing Act and the Equal Opportunity Act.


Click below for more reports

Durham Region

Township of Uxbridge

Township of Scugog

City of Kawartha Lakes


Neighbour News

Real Estate Stats December 6, 2023

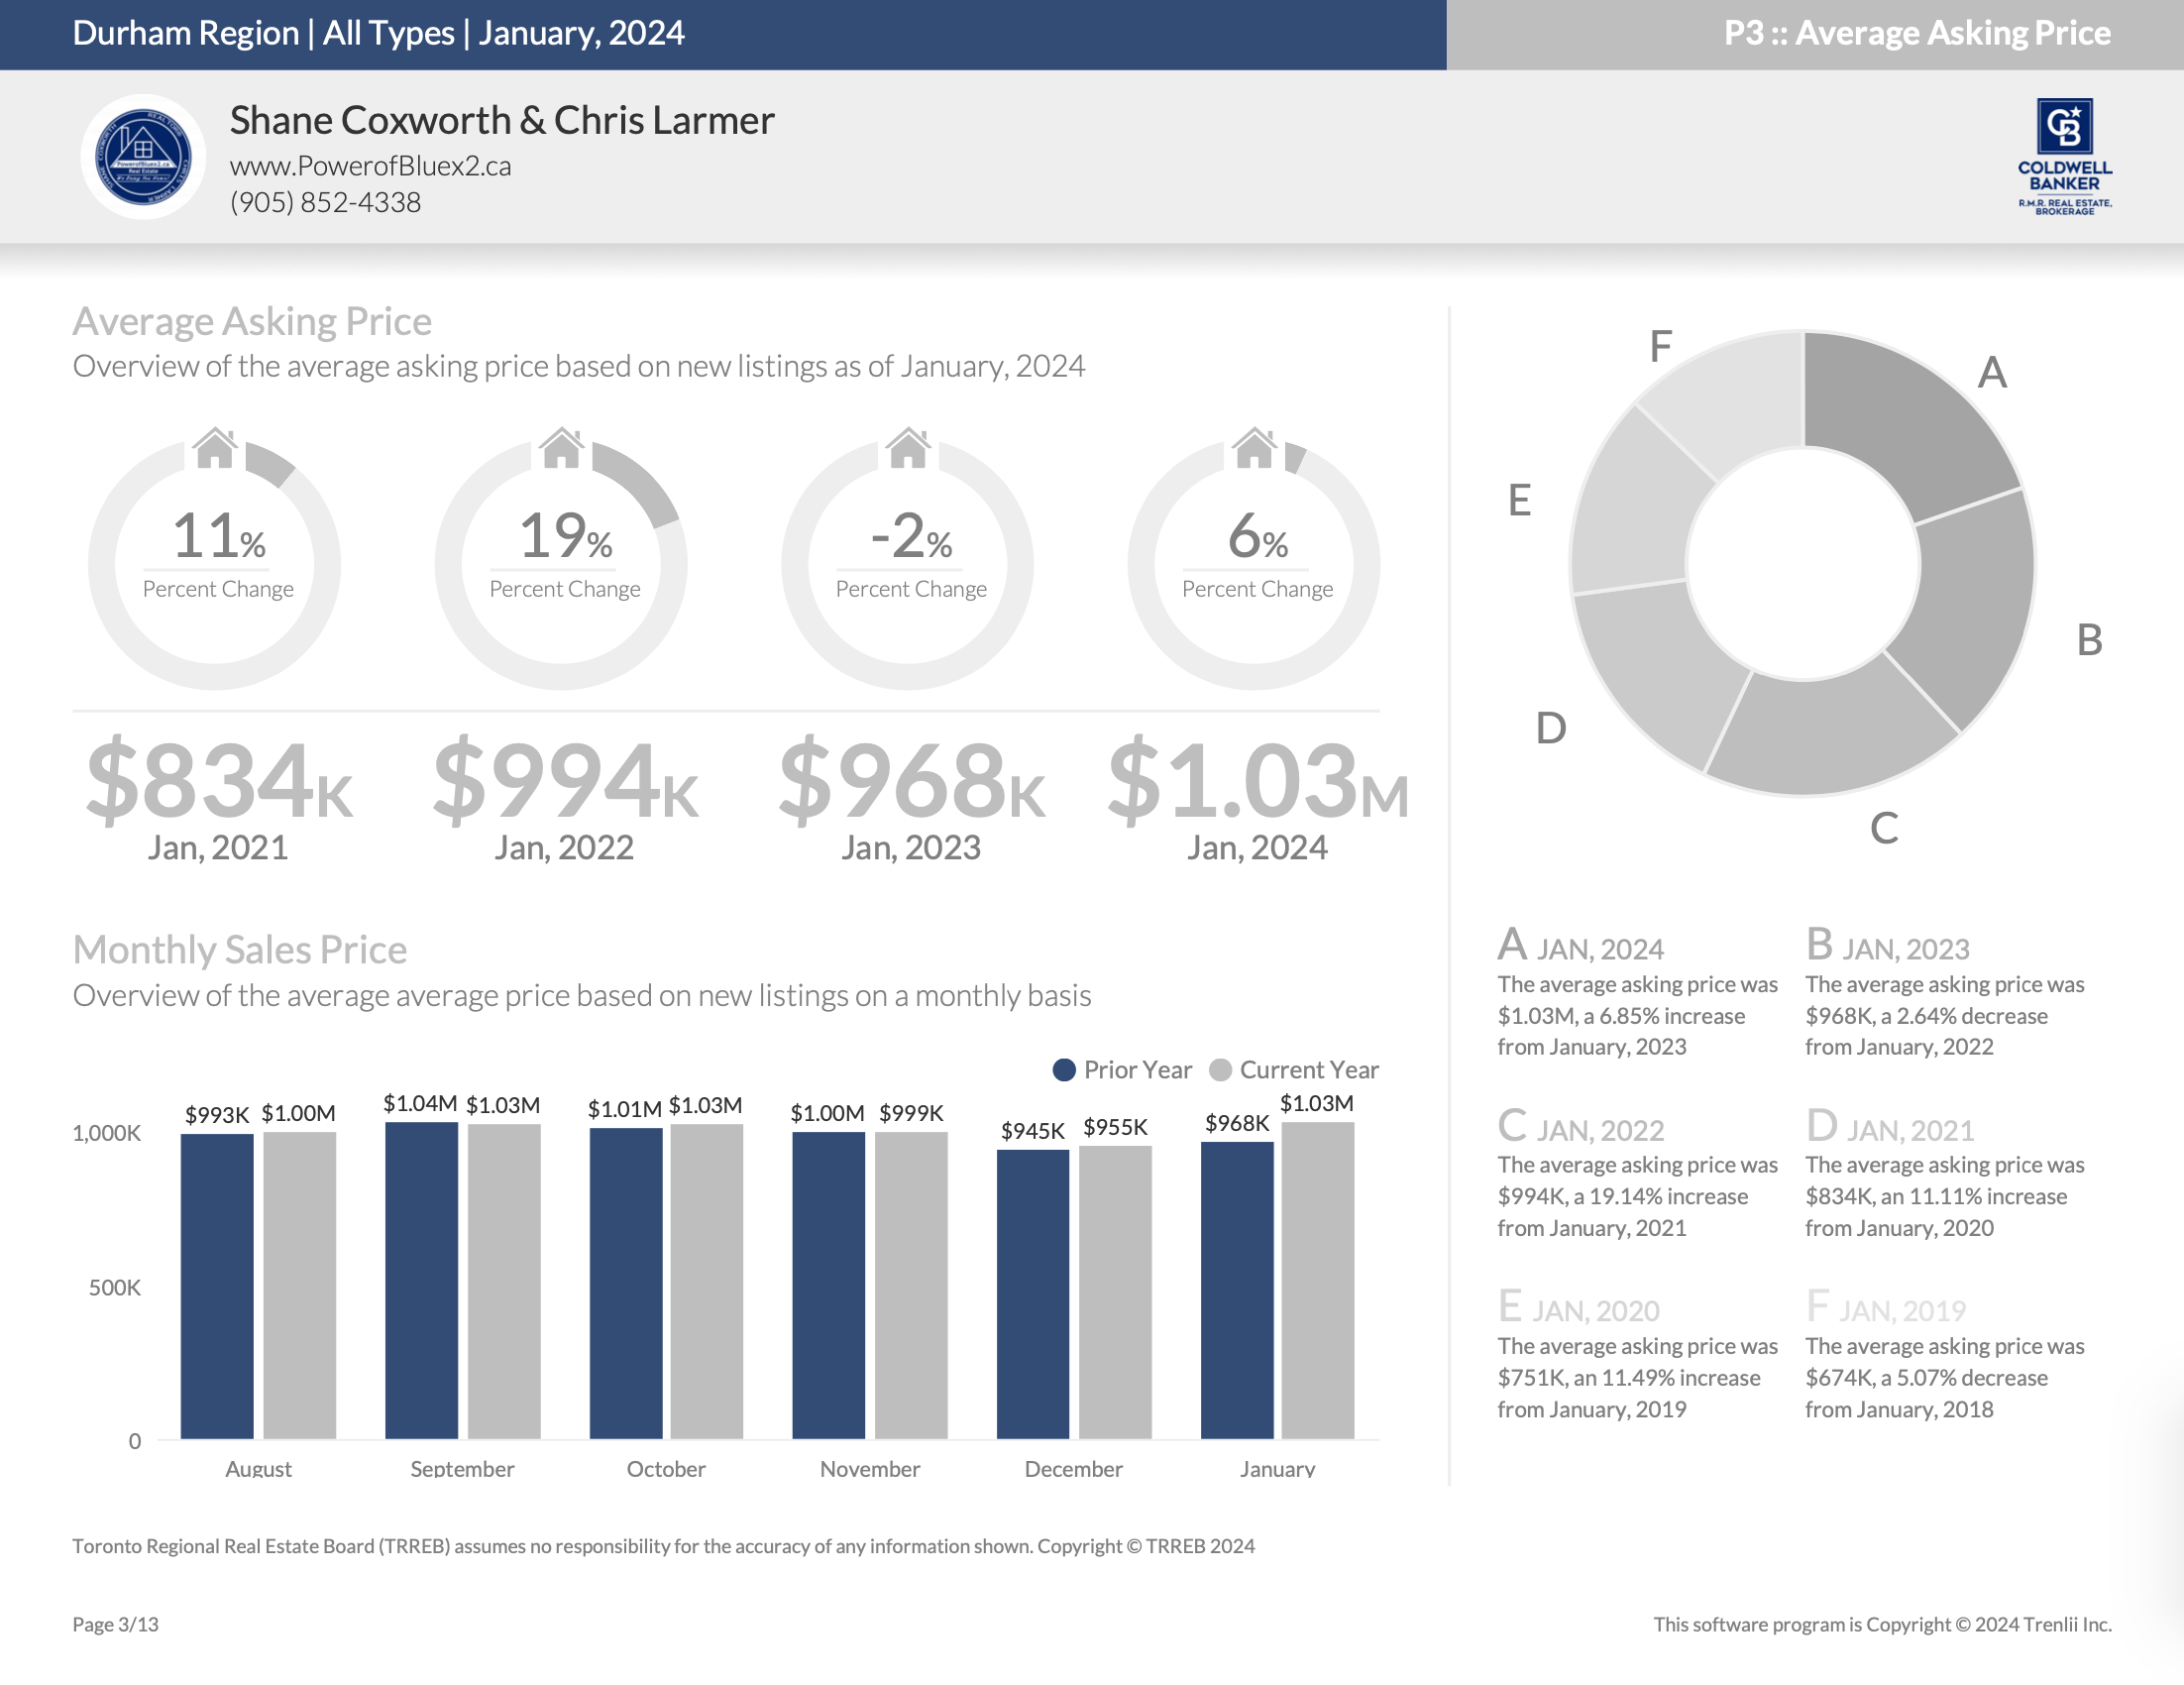
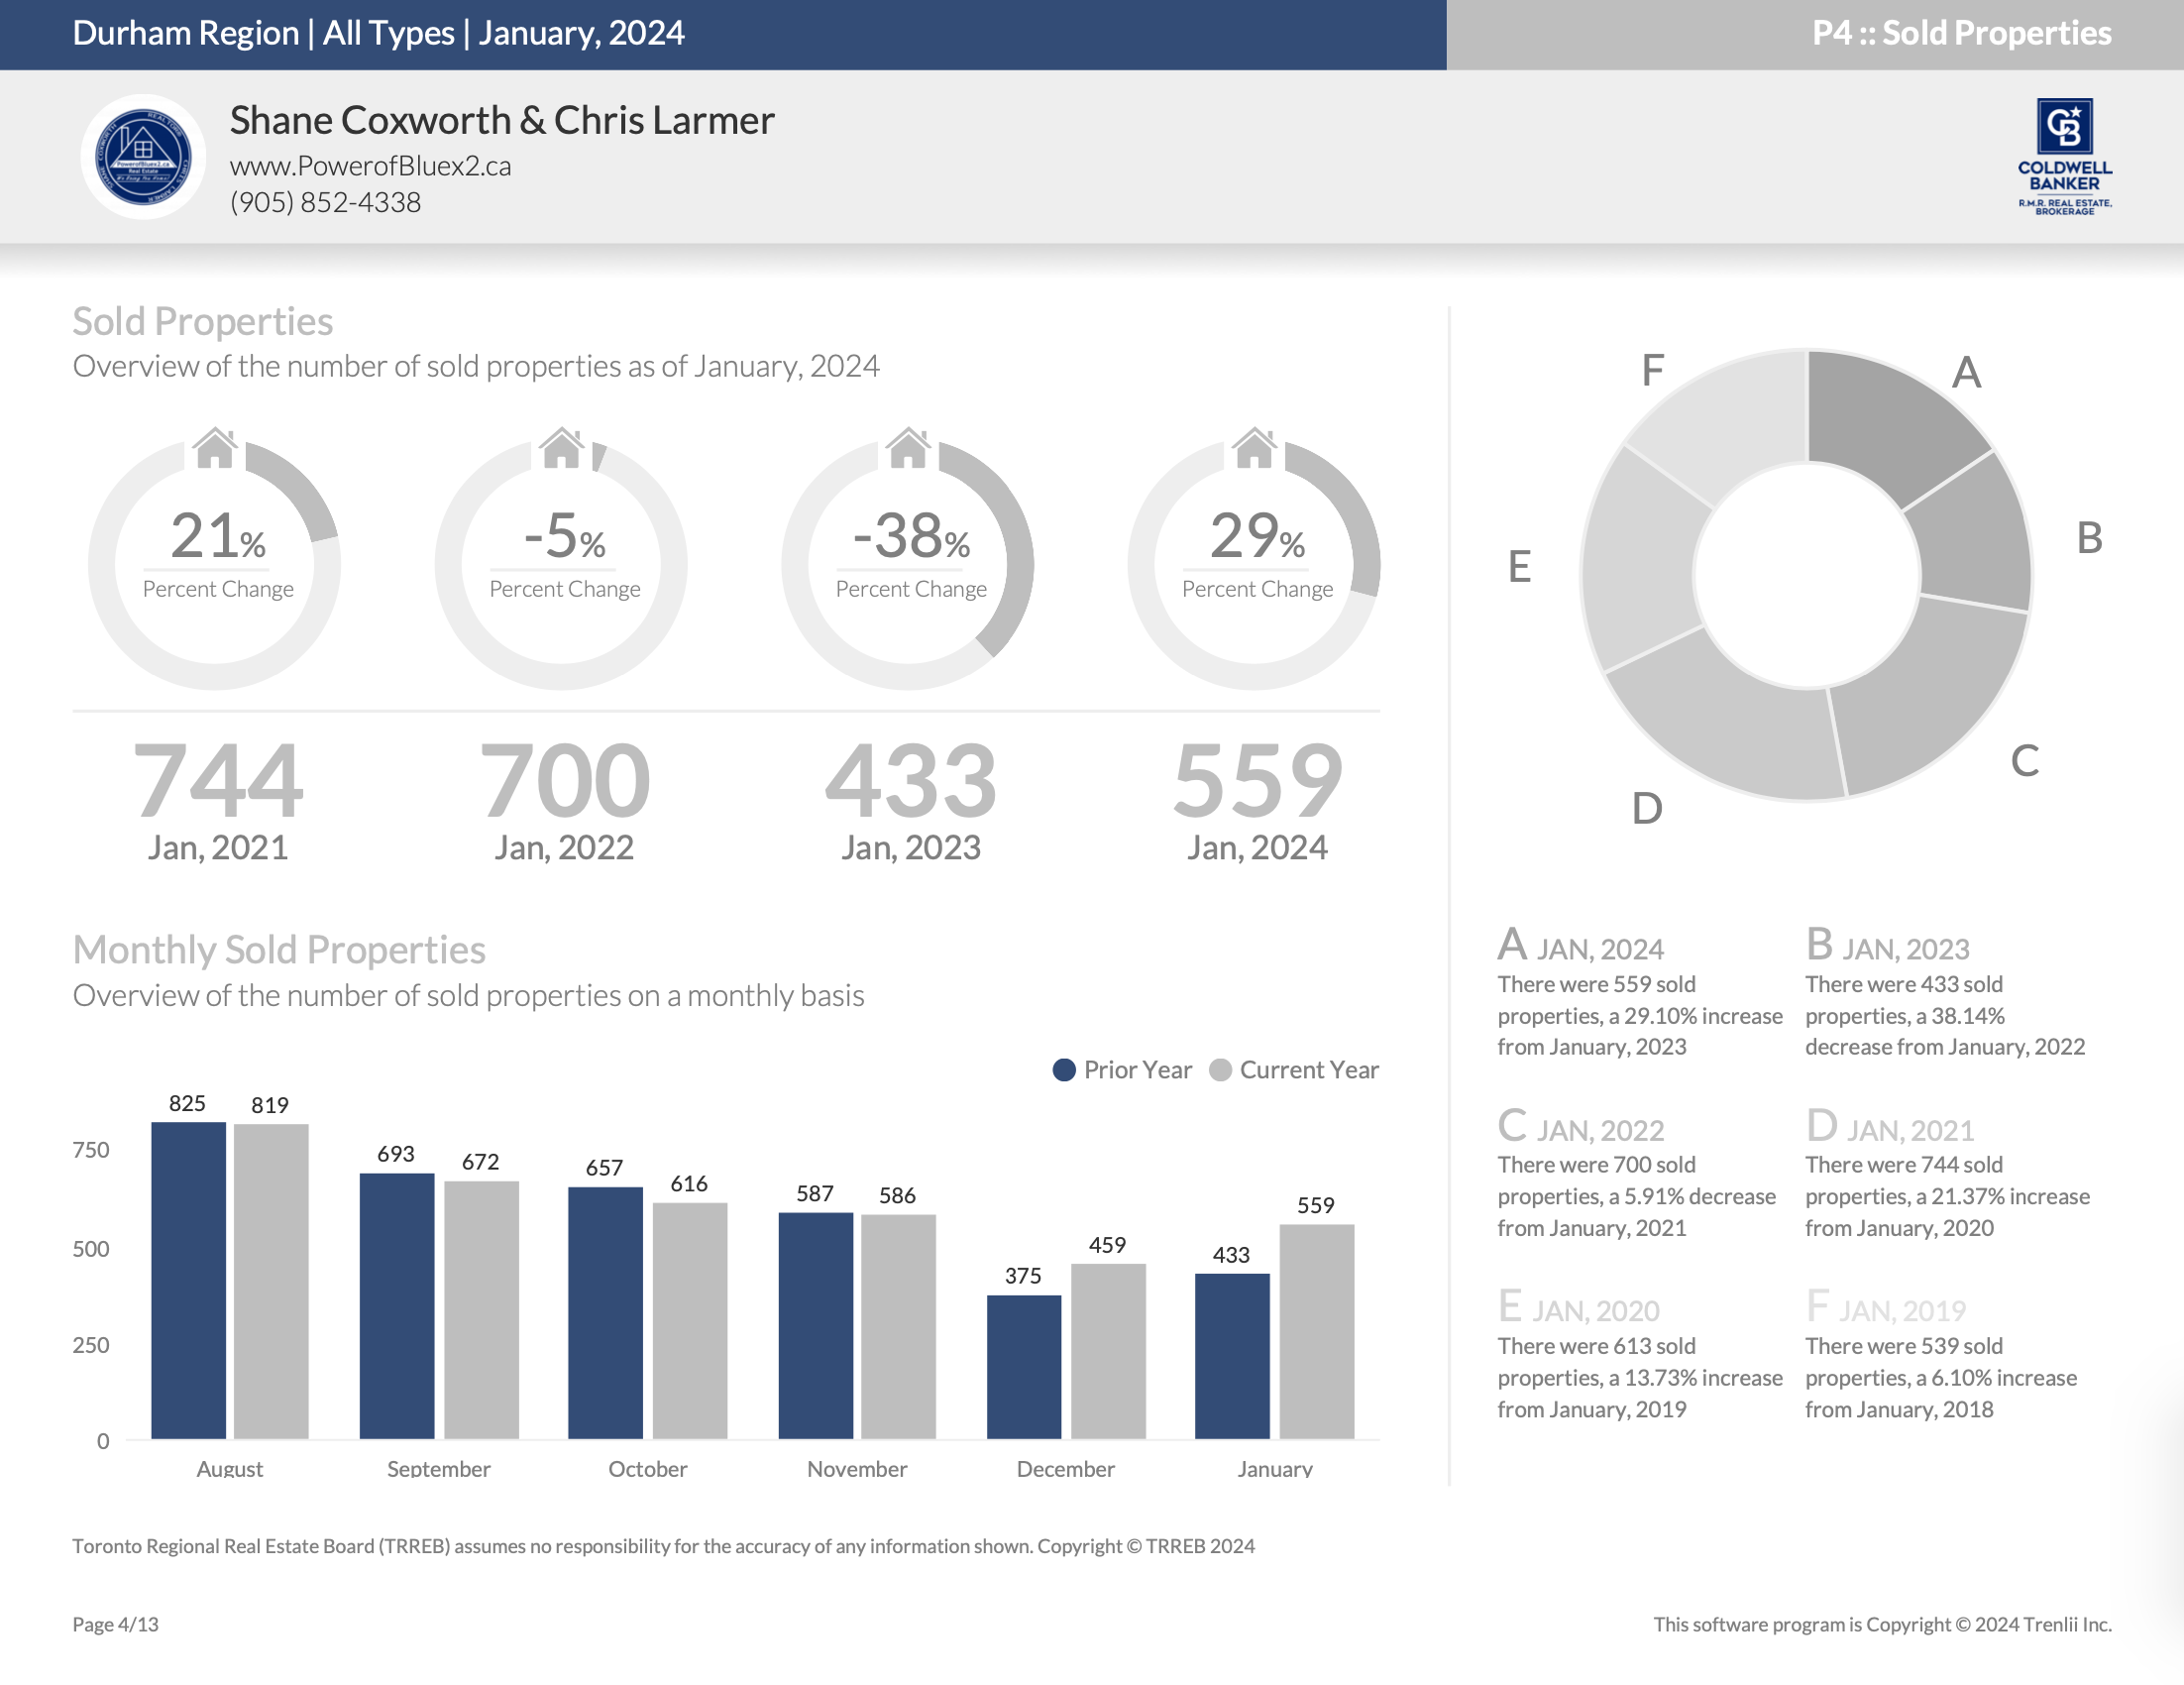
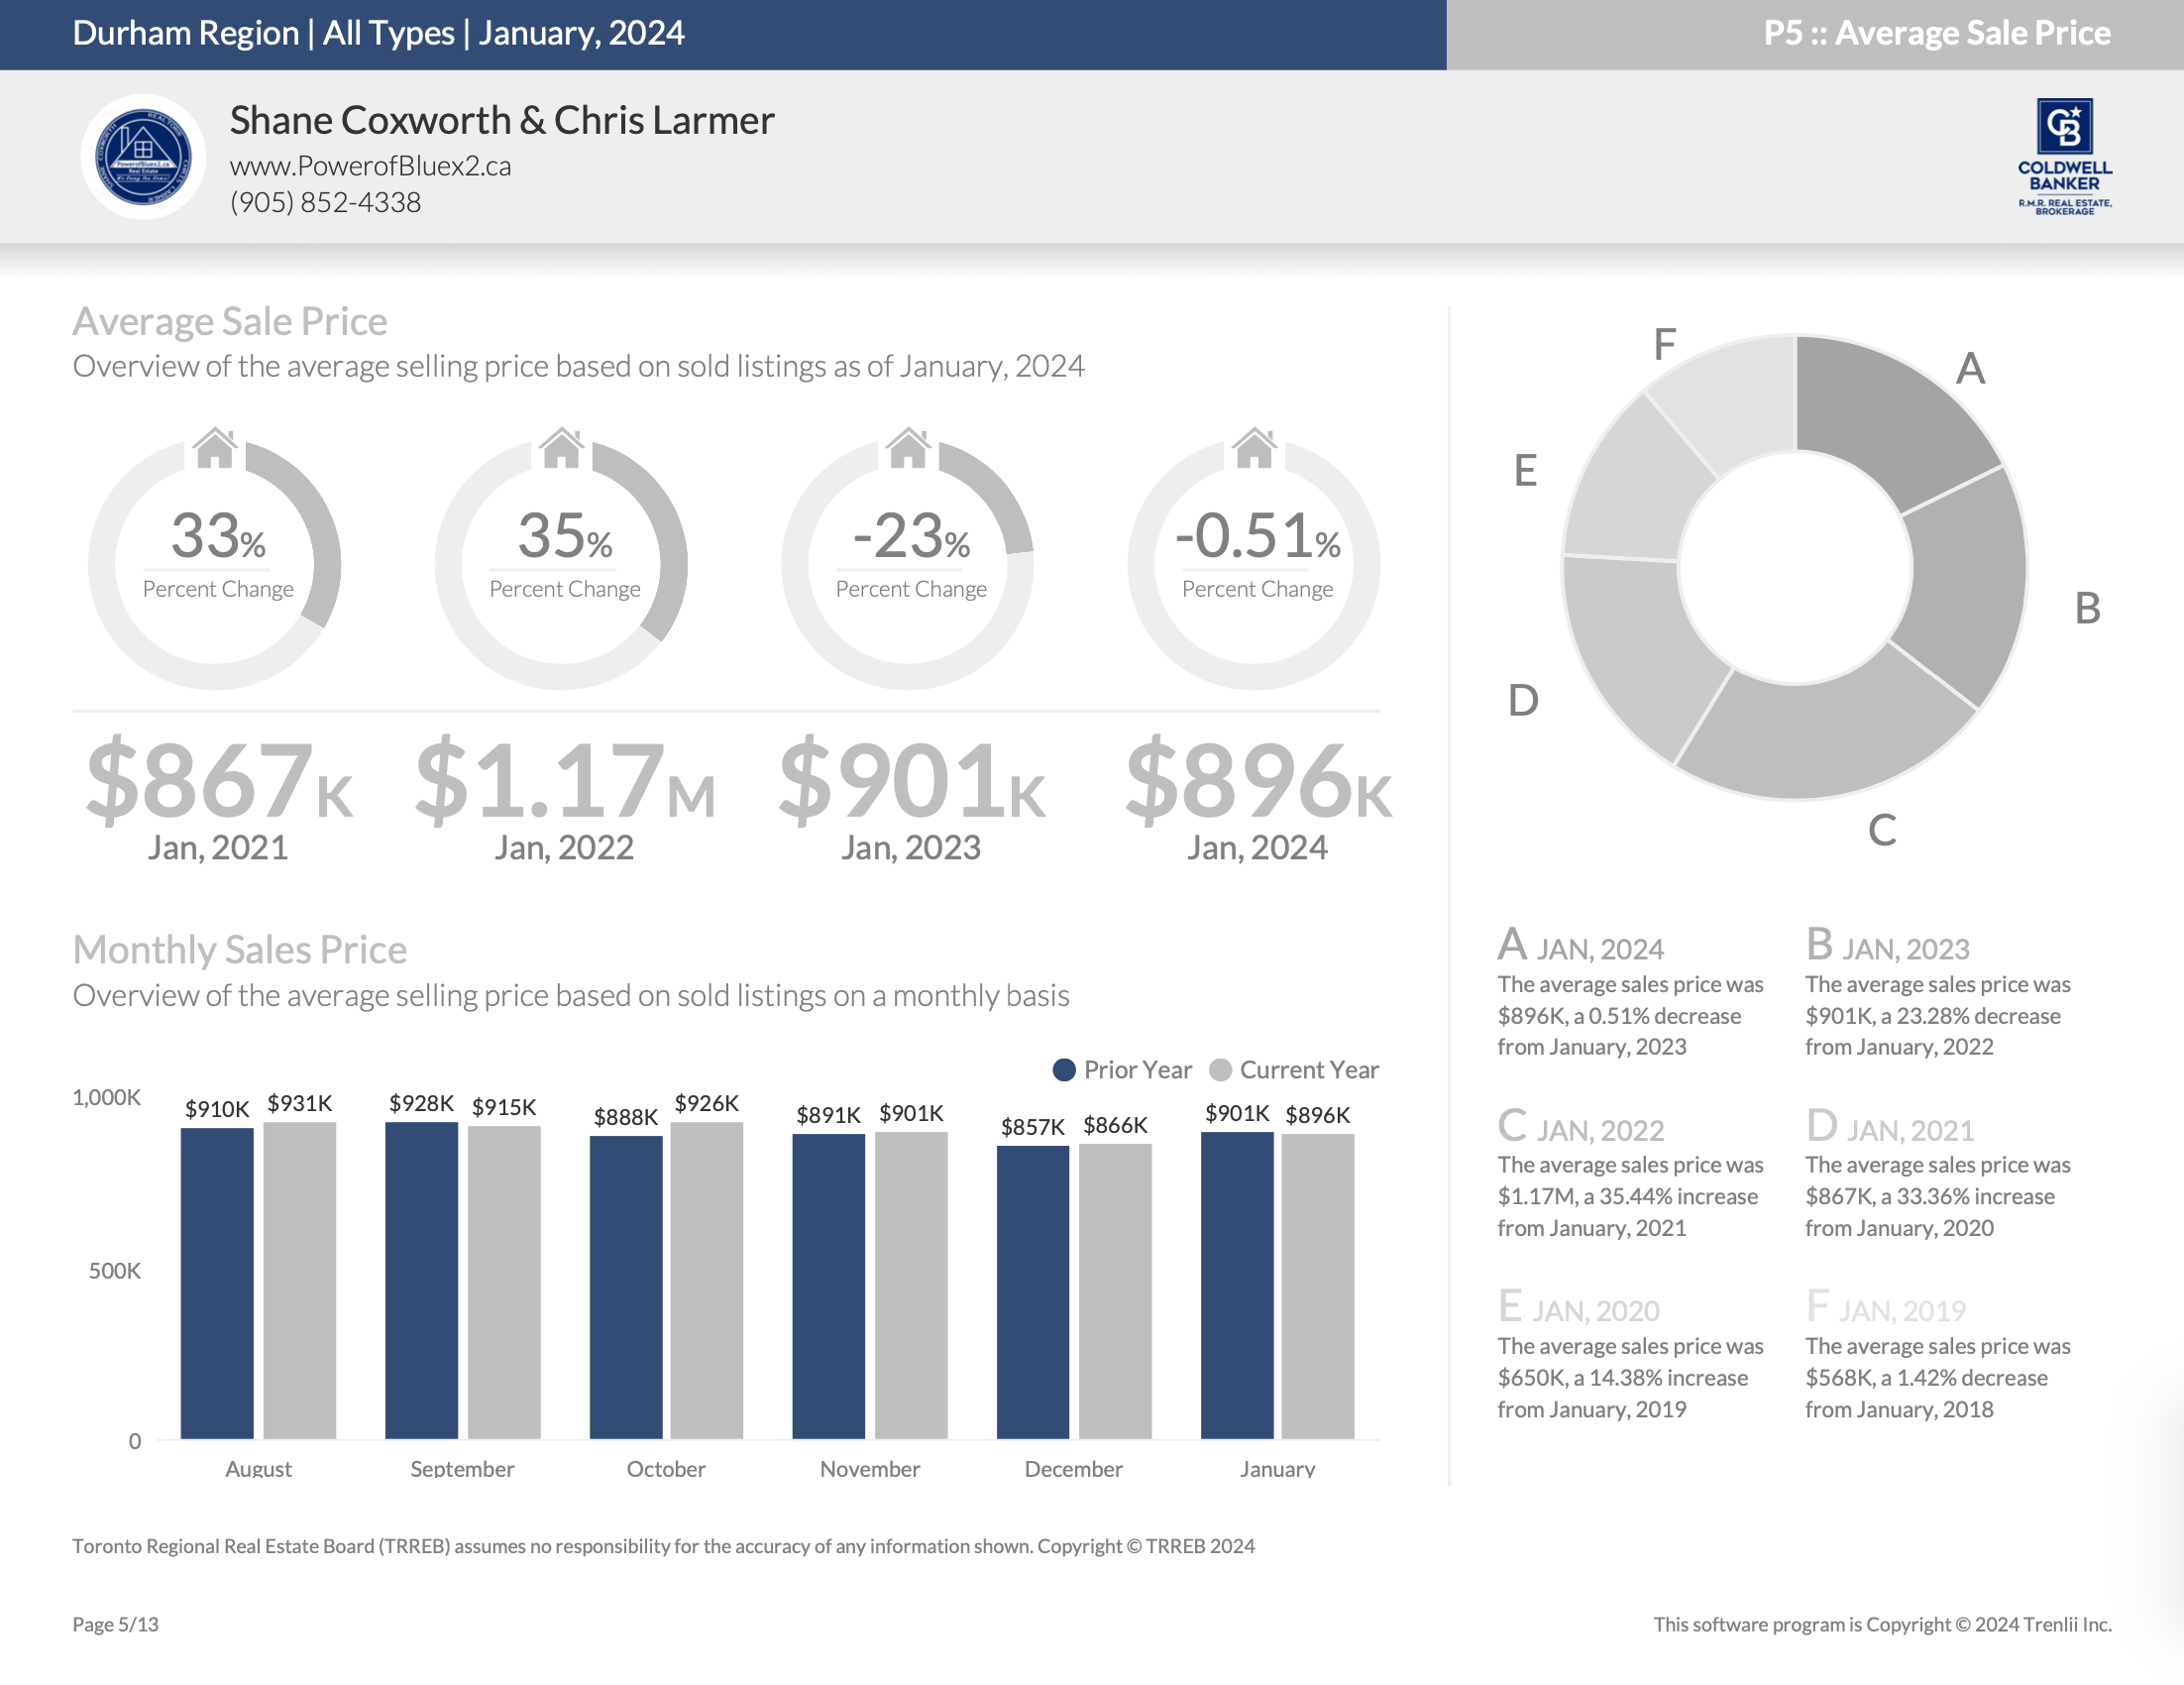
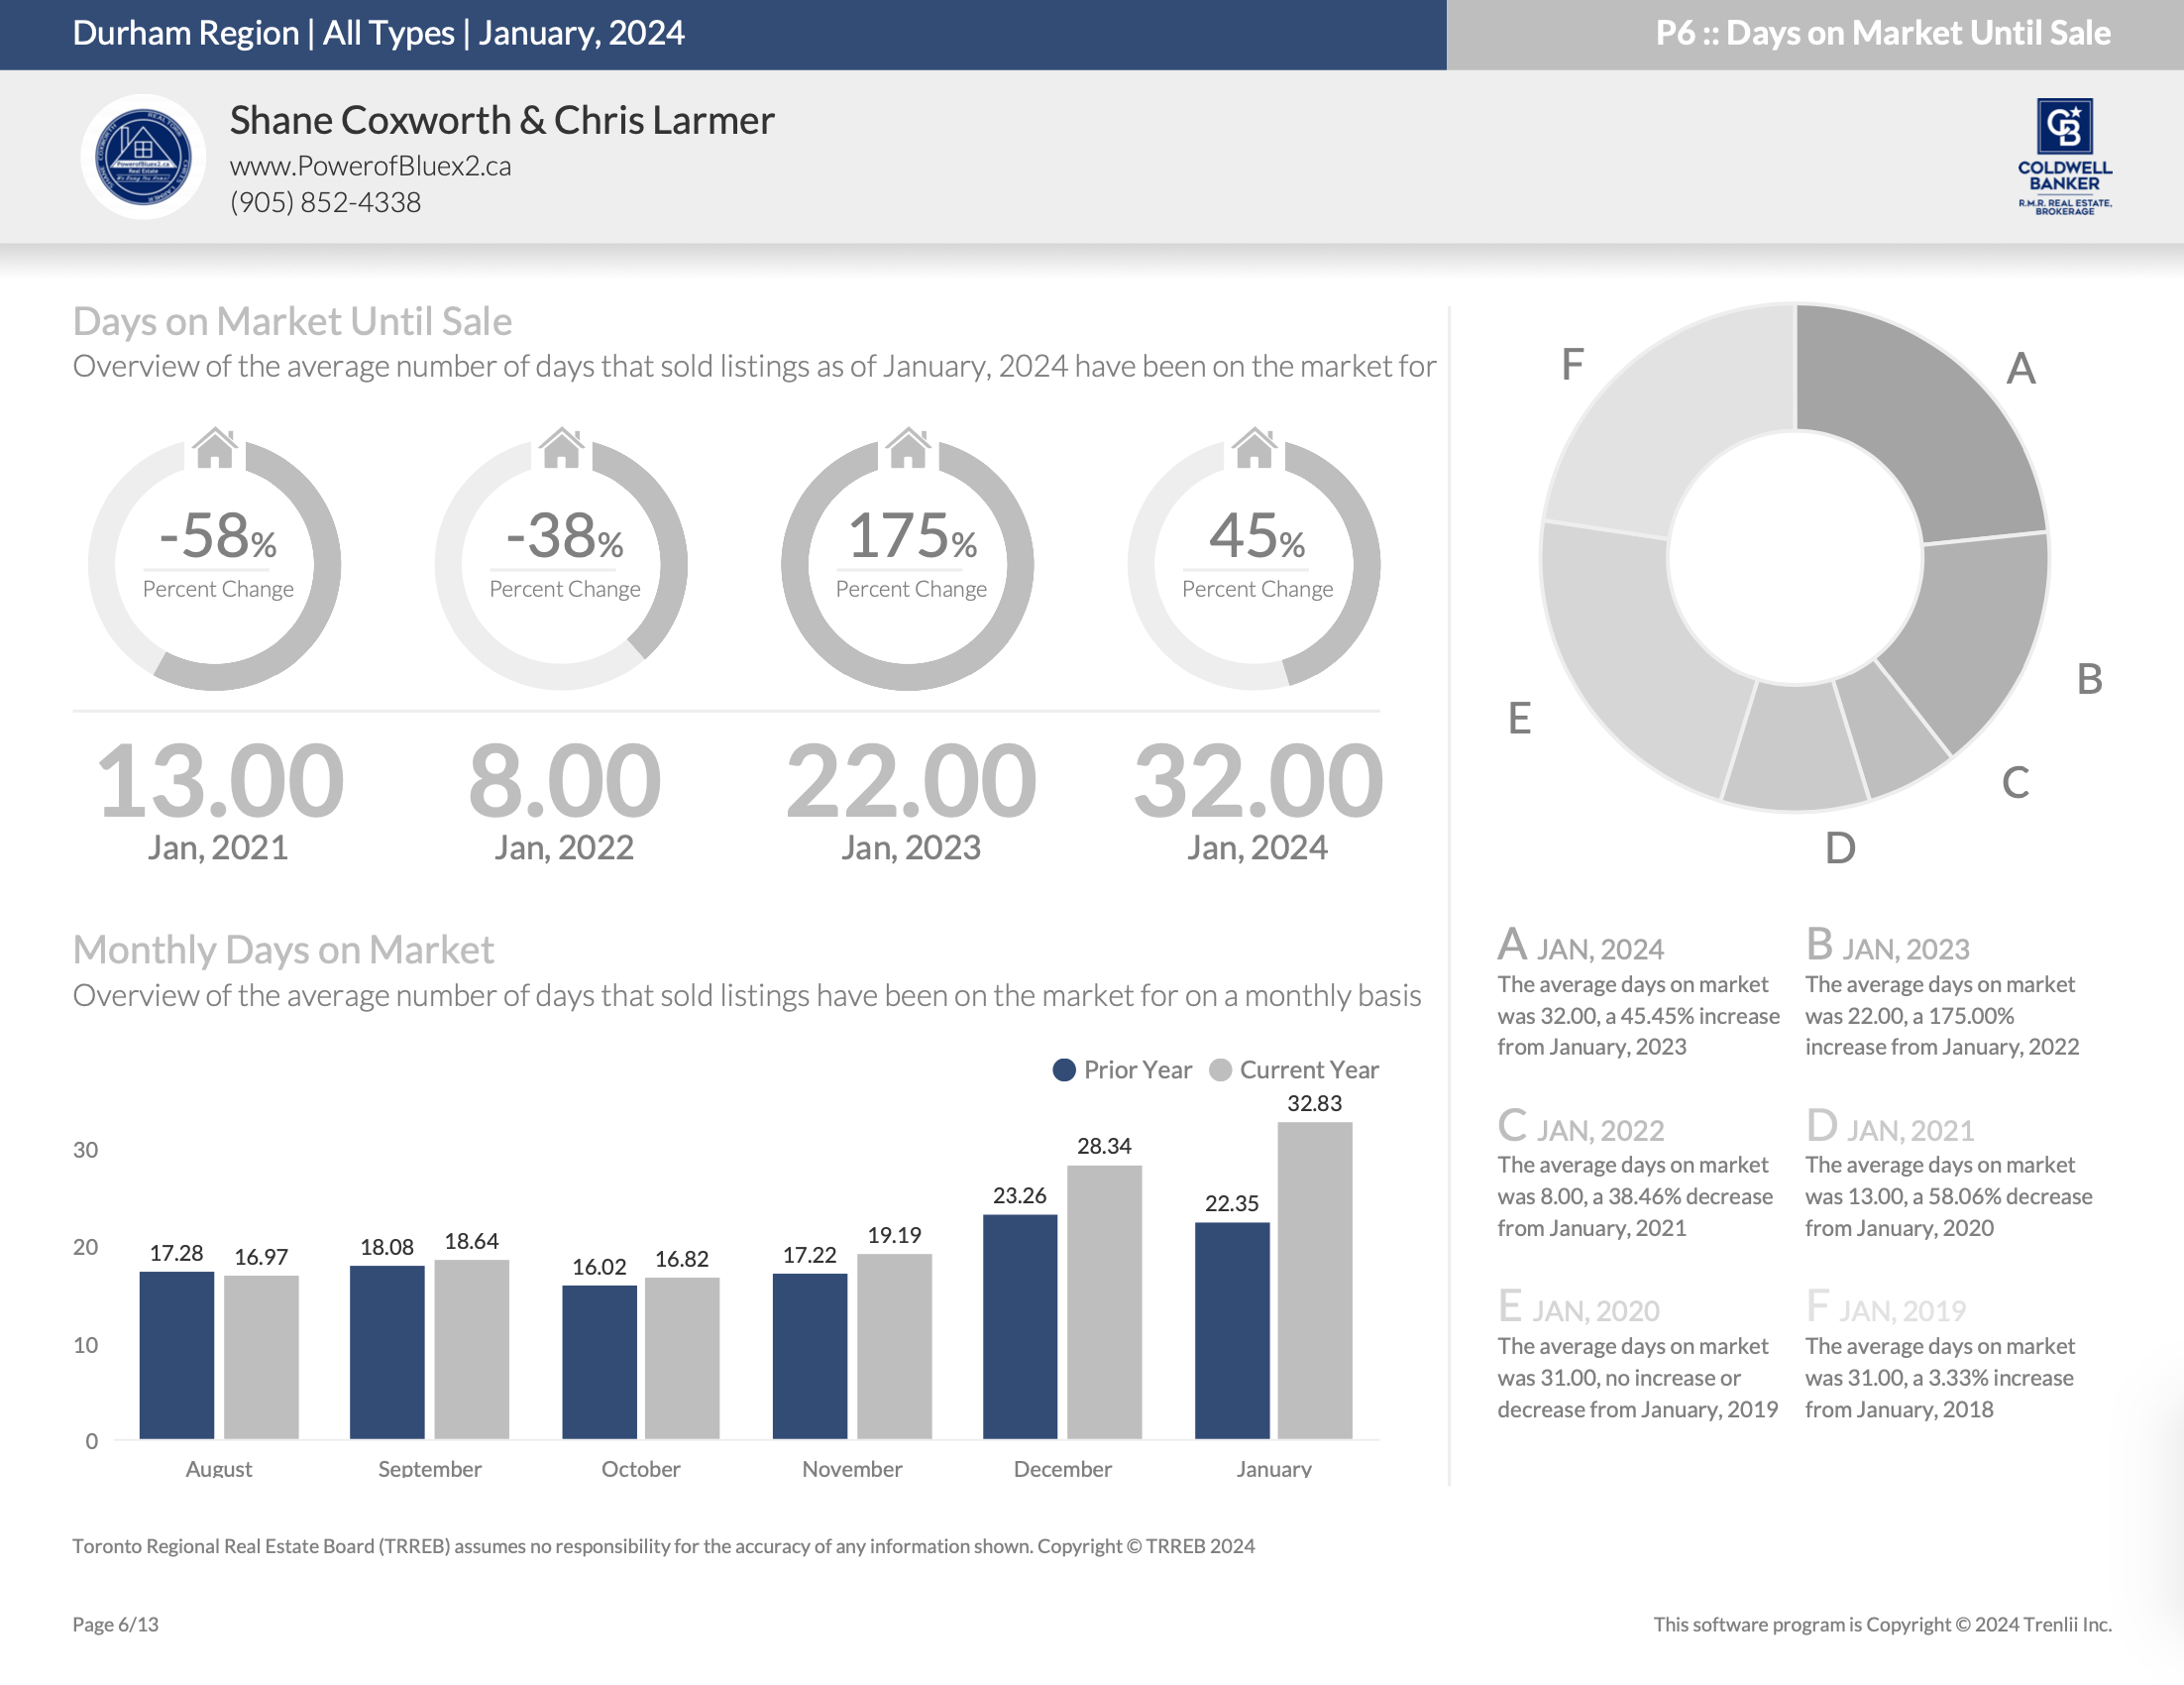
Durham Region Housing November 2023

Durham Region Housing November 2023

Durham Region

Housing Market Report for November 2023

Here is the Region of Durham  Housing November 2023 report (all housing types), with reports from the Canadian Real Estate AssociationToronto Regional Real Estate Board and the Durham Association of REALTORS®  included.

This housing report for Durham Region includes the number of new listings, average list price, number of properties sold, average selling price, average days on market and average asking price to selling price ratio for all property types within the Region of Durham.


Scroll to the bottom for links to take you to the housing market reports for Uxbridge, Scugog, Brock and the Kawartha Lakes.


CREA HOUSING MARKET REPORT – NOVEMBER 2023


From Toronto Regional Real Estate Board


Toronto Regional Real Estate Board – Market Stats At A Glance – November 2023


Read the Toronto Regional Real Estate Board  Market Watch Report 


Durham REALTORS® Report November 2023 Housing Statistics


Read the Durham Association of REALTORS® FULL Real Estate Report


Durham Region


Durham Region Full Report

*Some values may vary slightly based on the exact date and time the reports were generated.


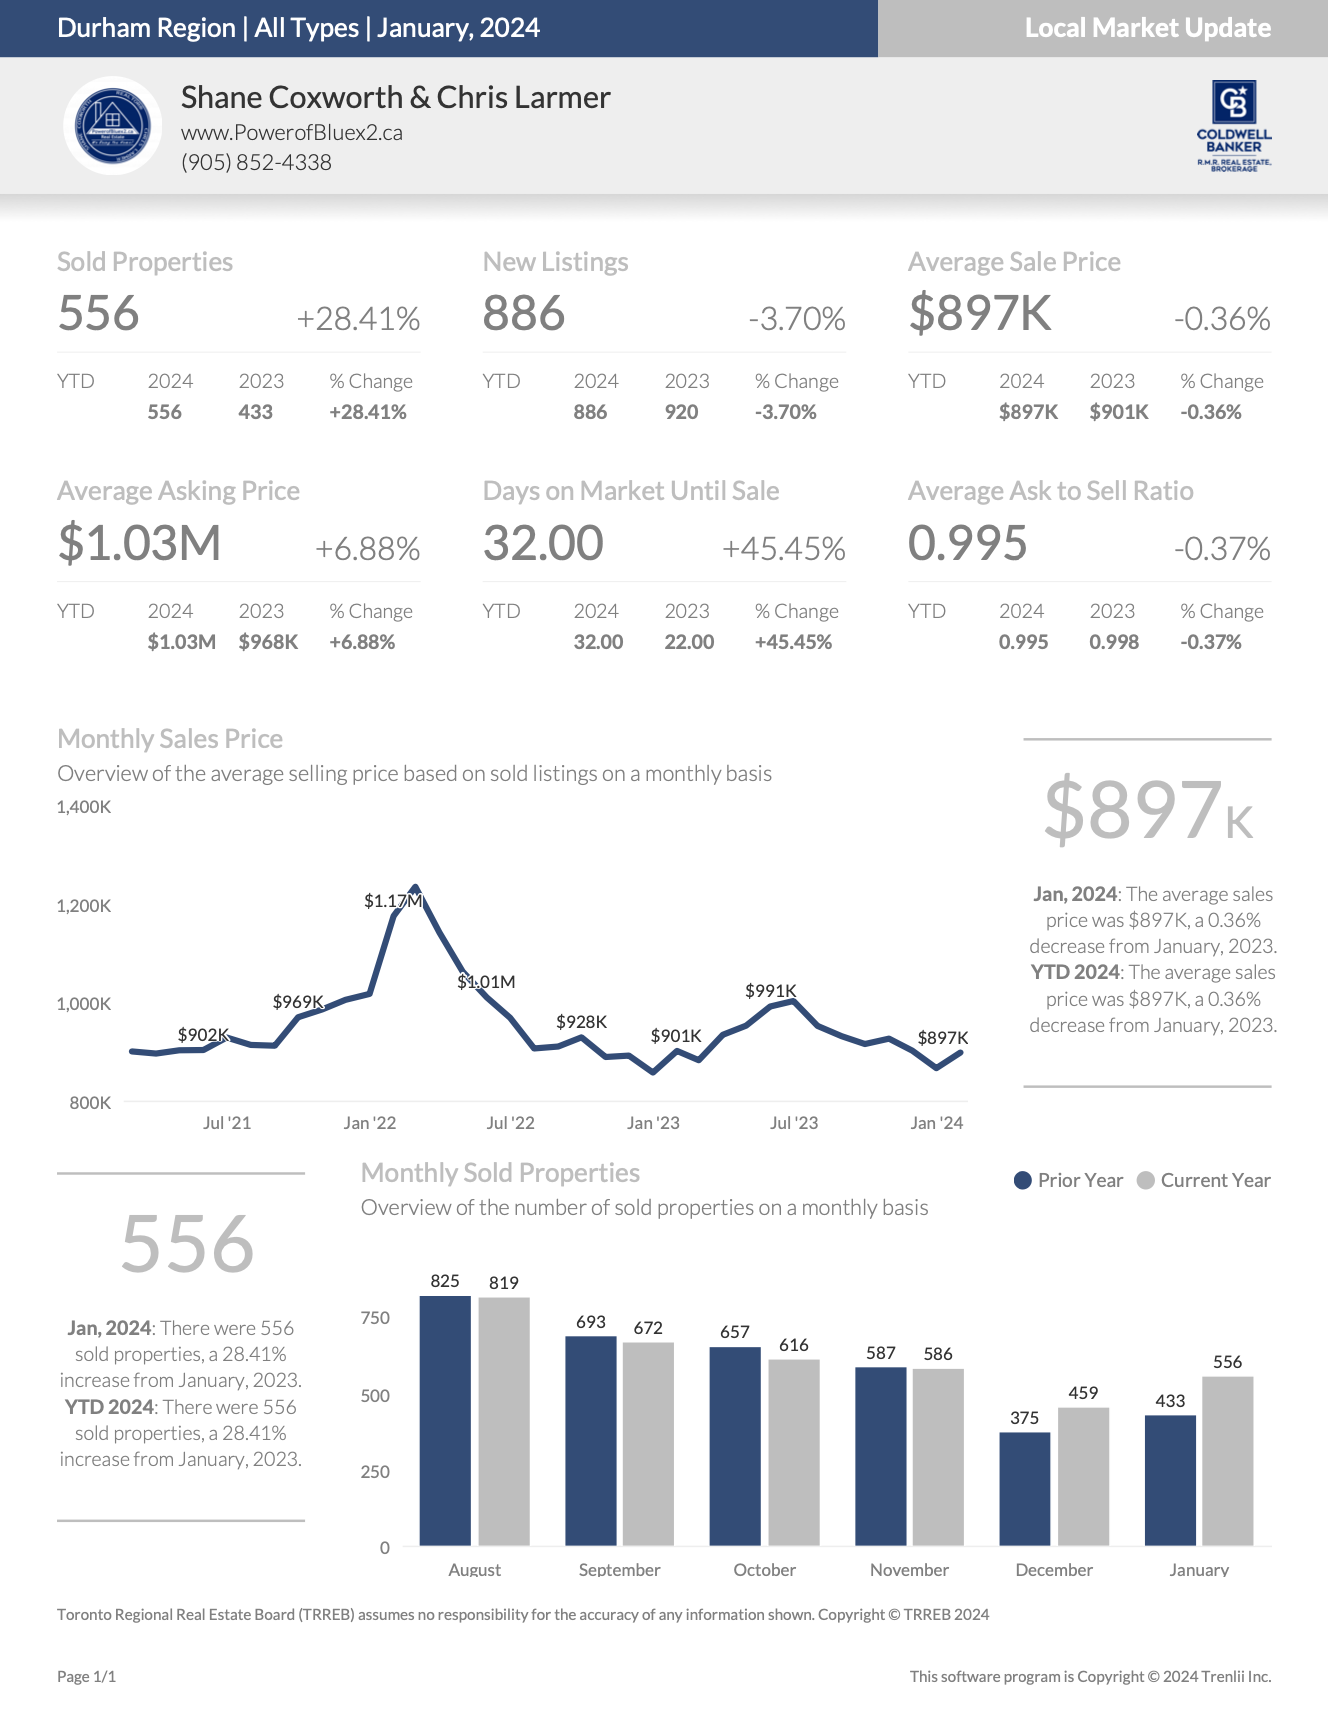
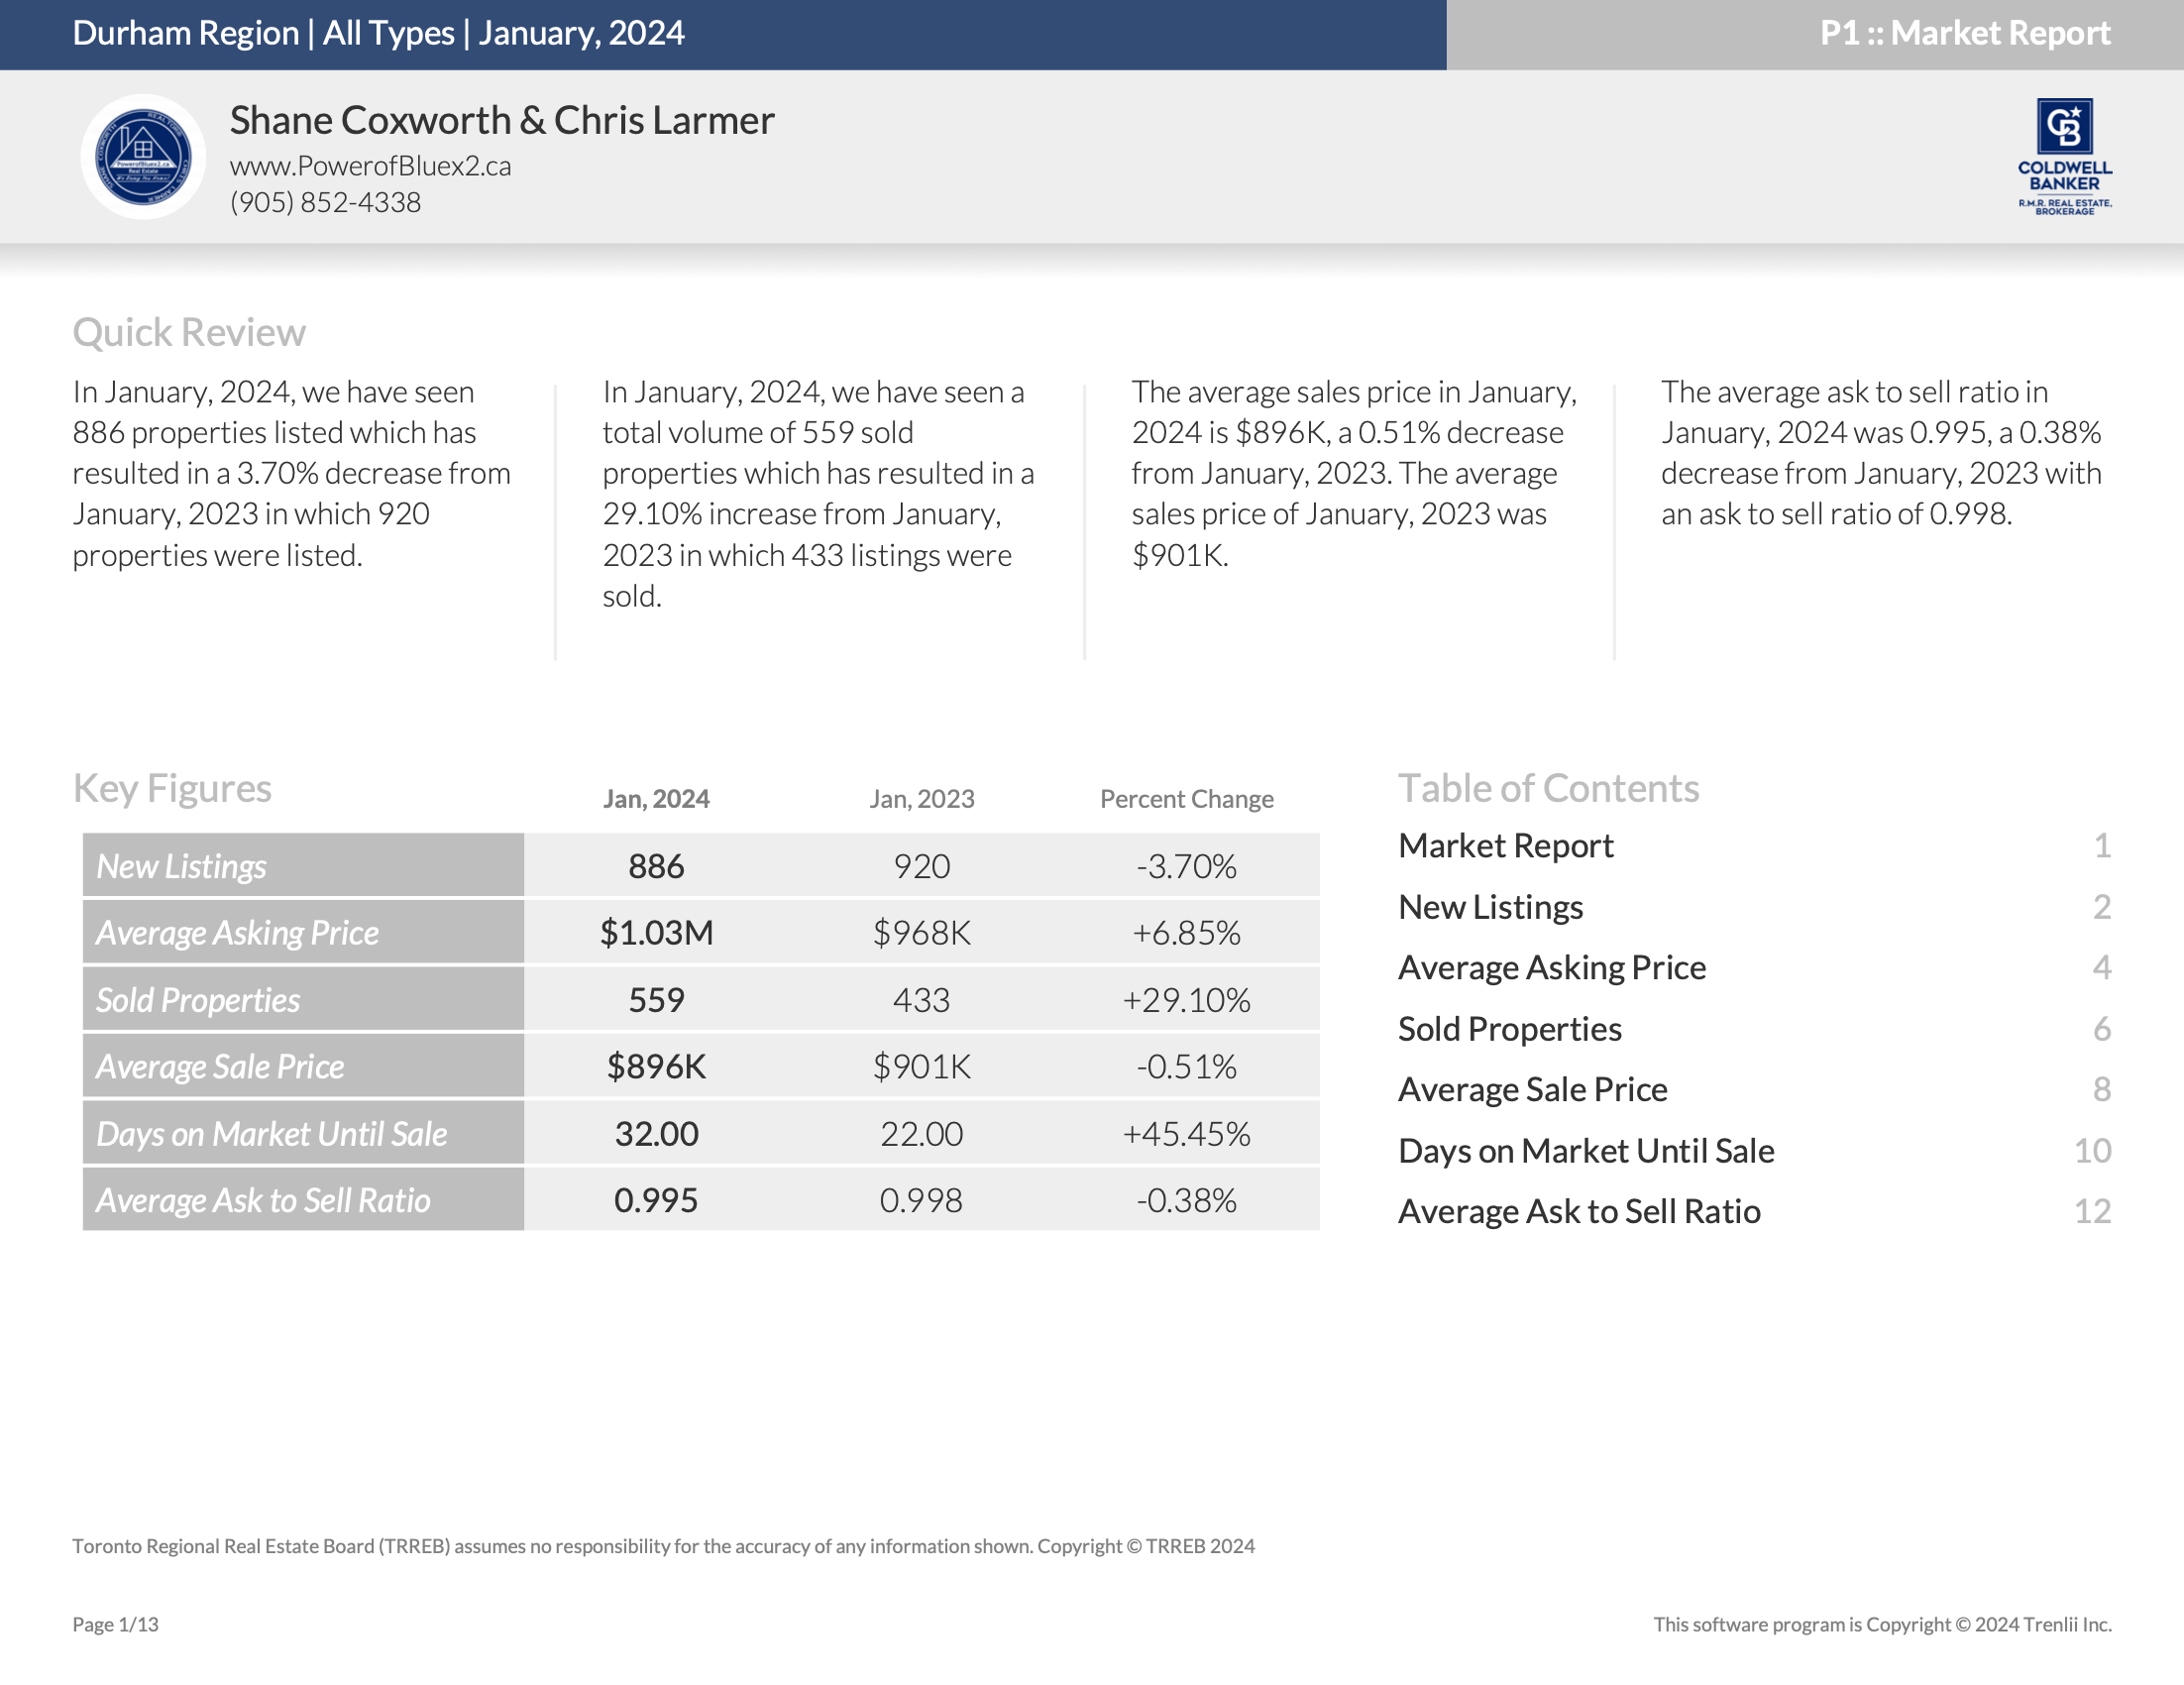
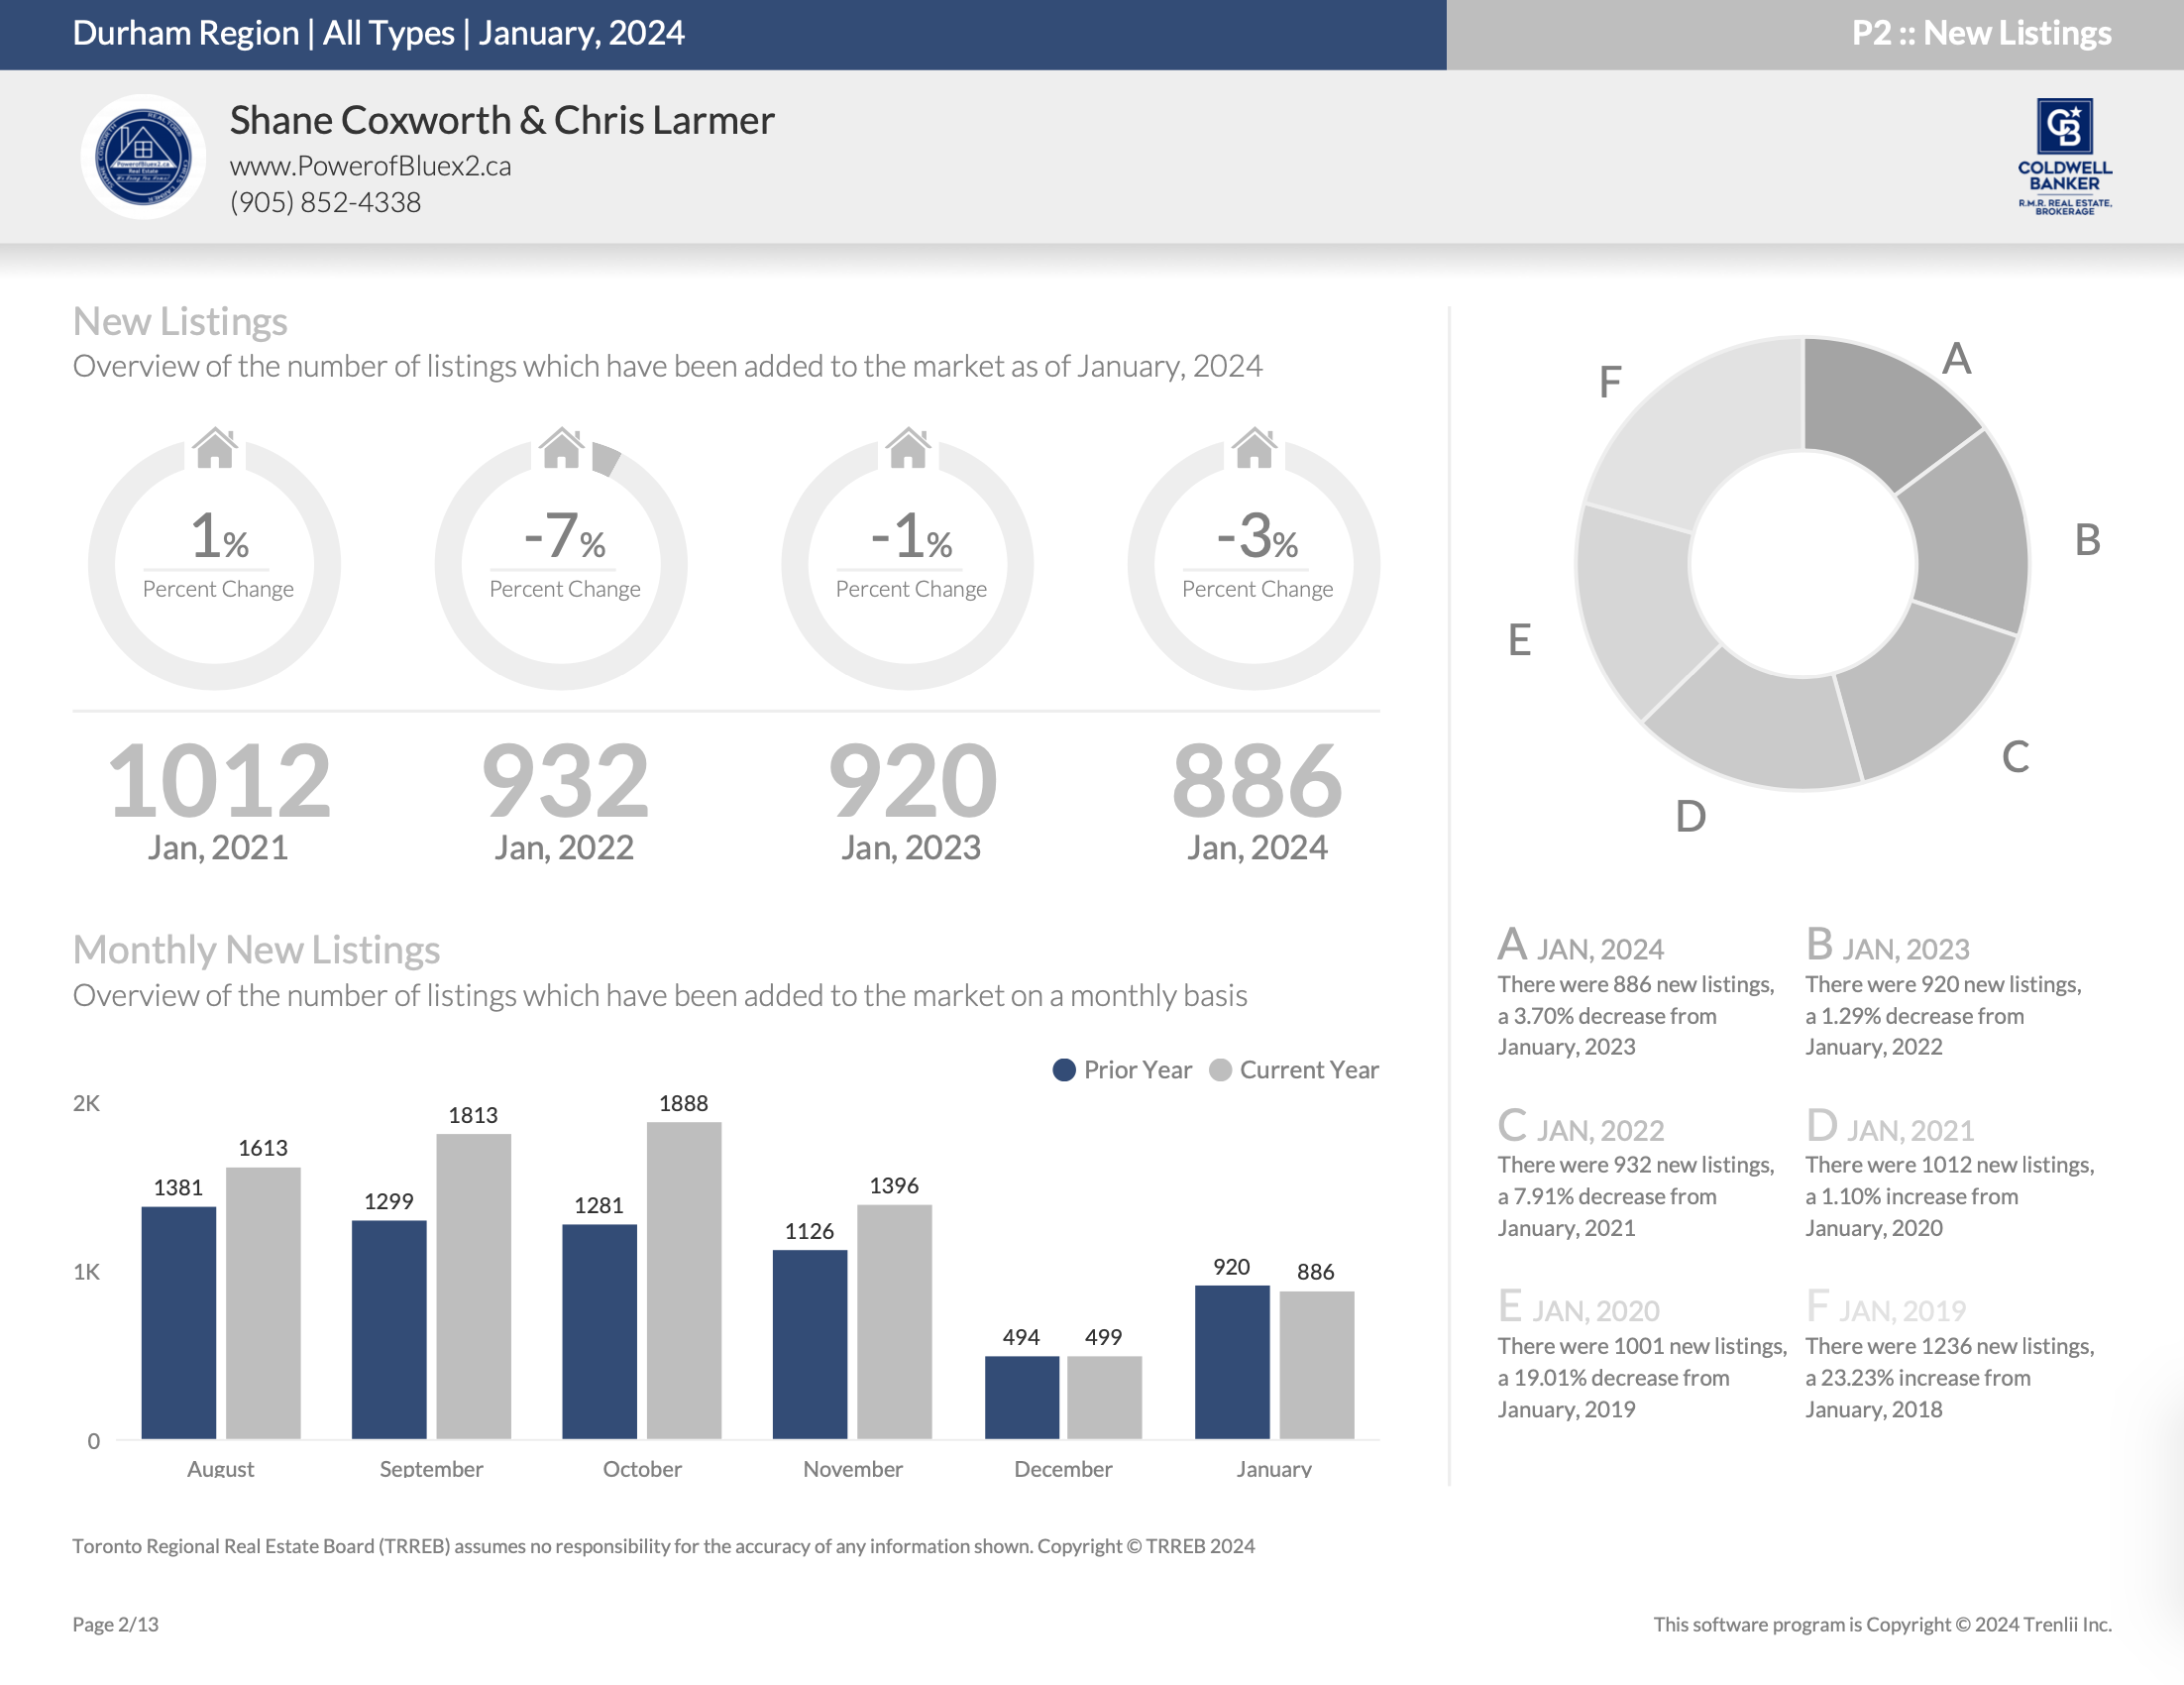
November 2023 brought notable shifts in the real estate market, with 1.39K properties listed—an impressive 23.80% increase from the same month in 2022. However, the year-to-date volume for 2023 stands at 16.8K, reflecting a 10.82% decrease compared to the 18.9K recorded in 2022.

In terms of property sales, November 2023 saw 575 properties changing hands, indicating a 2.04% decrease from November 2022. The year-to-date sales volume for 2023 is 8,484, showing a 15.01% decline from the 9,982 transactions in 2022.

The average sales price in November 2023 reached $903K, marking a 1.29% increase from November 2022’s $891K. However, the year-to-date average sales price for 2023 is $942K, reflecting an 8.64% decrease compared to the $1.03M recorded in 2022.

Examining the market dynamics, the average ask-to-sell ratio for November 2023 stands at 0.994, indicating a 1.26% decrease from the 1.007 ratio observed in November 2022. The year-to-date average ask-to-sell ratio for 2023 is 1.047, reflecting a 7.06% decrease from the 1.127 ratio in 2022. These trends highlight the evolving landscape of the real estate market, influencing both listing and selling dynamics.


Durham Region Housing November 2023


Quick Review

Durham Region Housing November 2023


New Listings – November 2023

Durham Region Housing November 2023


New Listings – Year-To-Date


Average Asking Price – November 2023

Durham Region Housing November 2023


Average Asking Price – Year-to-Date


Number of Properties Sold – November 2023

Durham Region Housing November 2023


Number of Properties Sold – Year-to-Date


Average Sold Price – November 2023

Durham Region Housing November 2023


Average Sold Price – Year-to-Date


Days on Market – November 2023

Durham Region Housing November 2023


Days on Market – Year-to-Date


Average List Price to Sell Price Ratio – November 2023

Durham Region Housing November 2023


Average List Price to Sell Price Ratio – Year-to-Date


*Information is believed to be accurate at time of posting but is not guaranteed to be correct 

Not intended as a solicitation if your property is already listed by another broker. Affiliated real estate agents are independent contractor sales associates, not employees. ©2021 Coldwell Banker. All Rights Reserved. Coldwell Banker and the Coldwell Banker logos are trademarks of Coldwell Banker Real Estate LLC. The Coldwell Banker® System is comprised of company owned offices which are owned by a subsidiary of Realogy Brokerage Group LLC and franchised offices which are independently owned and operated. The Coldwell Banker System fully supports the principles of the Fair Housing Act and the Equal Opportunity Act.


Click below for more reports

Township of Uxbridge

Township of Scugog

Township Brock

City of Kawartha Lakes 


Neighbour News

December 4, 2023

Monday Market Minute December 4

Monday Market Minute December 4

Week of Sunday November 26 – Saturday December 2

Weekly Real Estate Market Minute for the Townships of Uxbridge and Scugog


Thank You For Watching

The Monday Market Minute December 4

See the October 2023 Housing Reports for

Check out our Uxbridge and Scugog Events Pages to keep up to date on whats going on around town.  Click the links or scan the Code with your phone to take you directly there.


UXBRIDGE EVENTS


SCUGOG EVENTS 


Neighbour News

November 29, 2023

12 Spruce Street Uxbridge

12 Spruce Street, Uxbridge


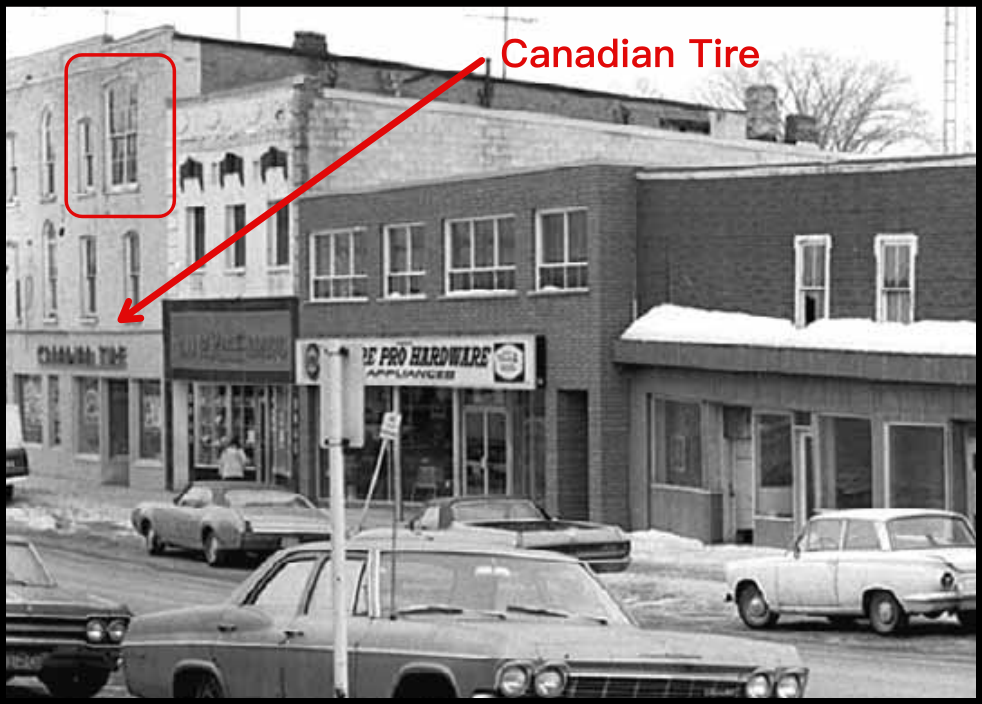
The building was originally opened in 1945 as an egg grading station by Silverwoods Dairy. In 1954 the township purchased the building and renovated it to be the first municipal office in the towns history. The township later sold the building in 1974 when the Region of Durham was formed. The building was then the home of the police station until 1999 when it was purchased and reopened as the Vintner’s Nook, a wine making and equipment/supplies store.


The above Google street view image shows the building in 2016 before it was demolished.


It was discovered that a contamination bloom had spread under the building from the neighbouring gas station and in December 2016 Shell Canada took ownership to take responsibility to clean up the property. The town council received many calls and emails from residents urging them to do something to save the building but it became clear that it would have to be demolished as part of the clean up. 


Read about it here in the Uxbridge Cosmos

https://thecosmos.ca/wp-content/uploads/2017/06/June15.pdf


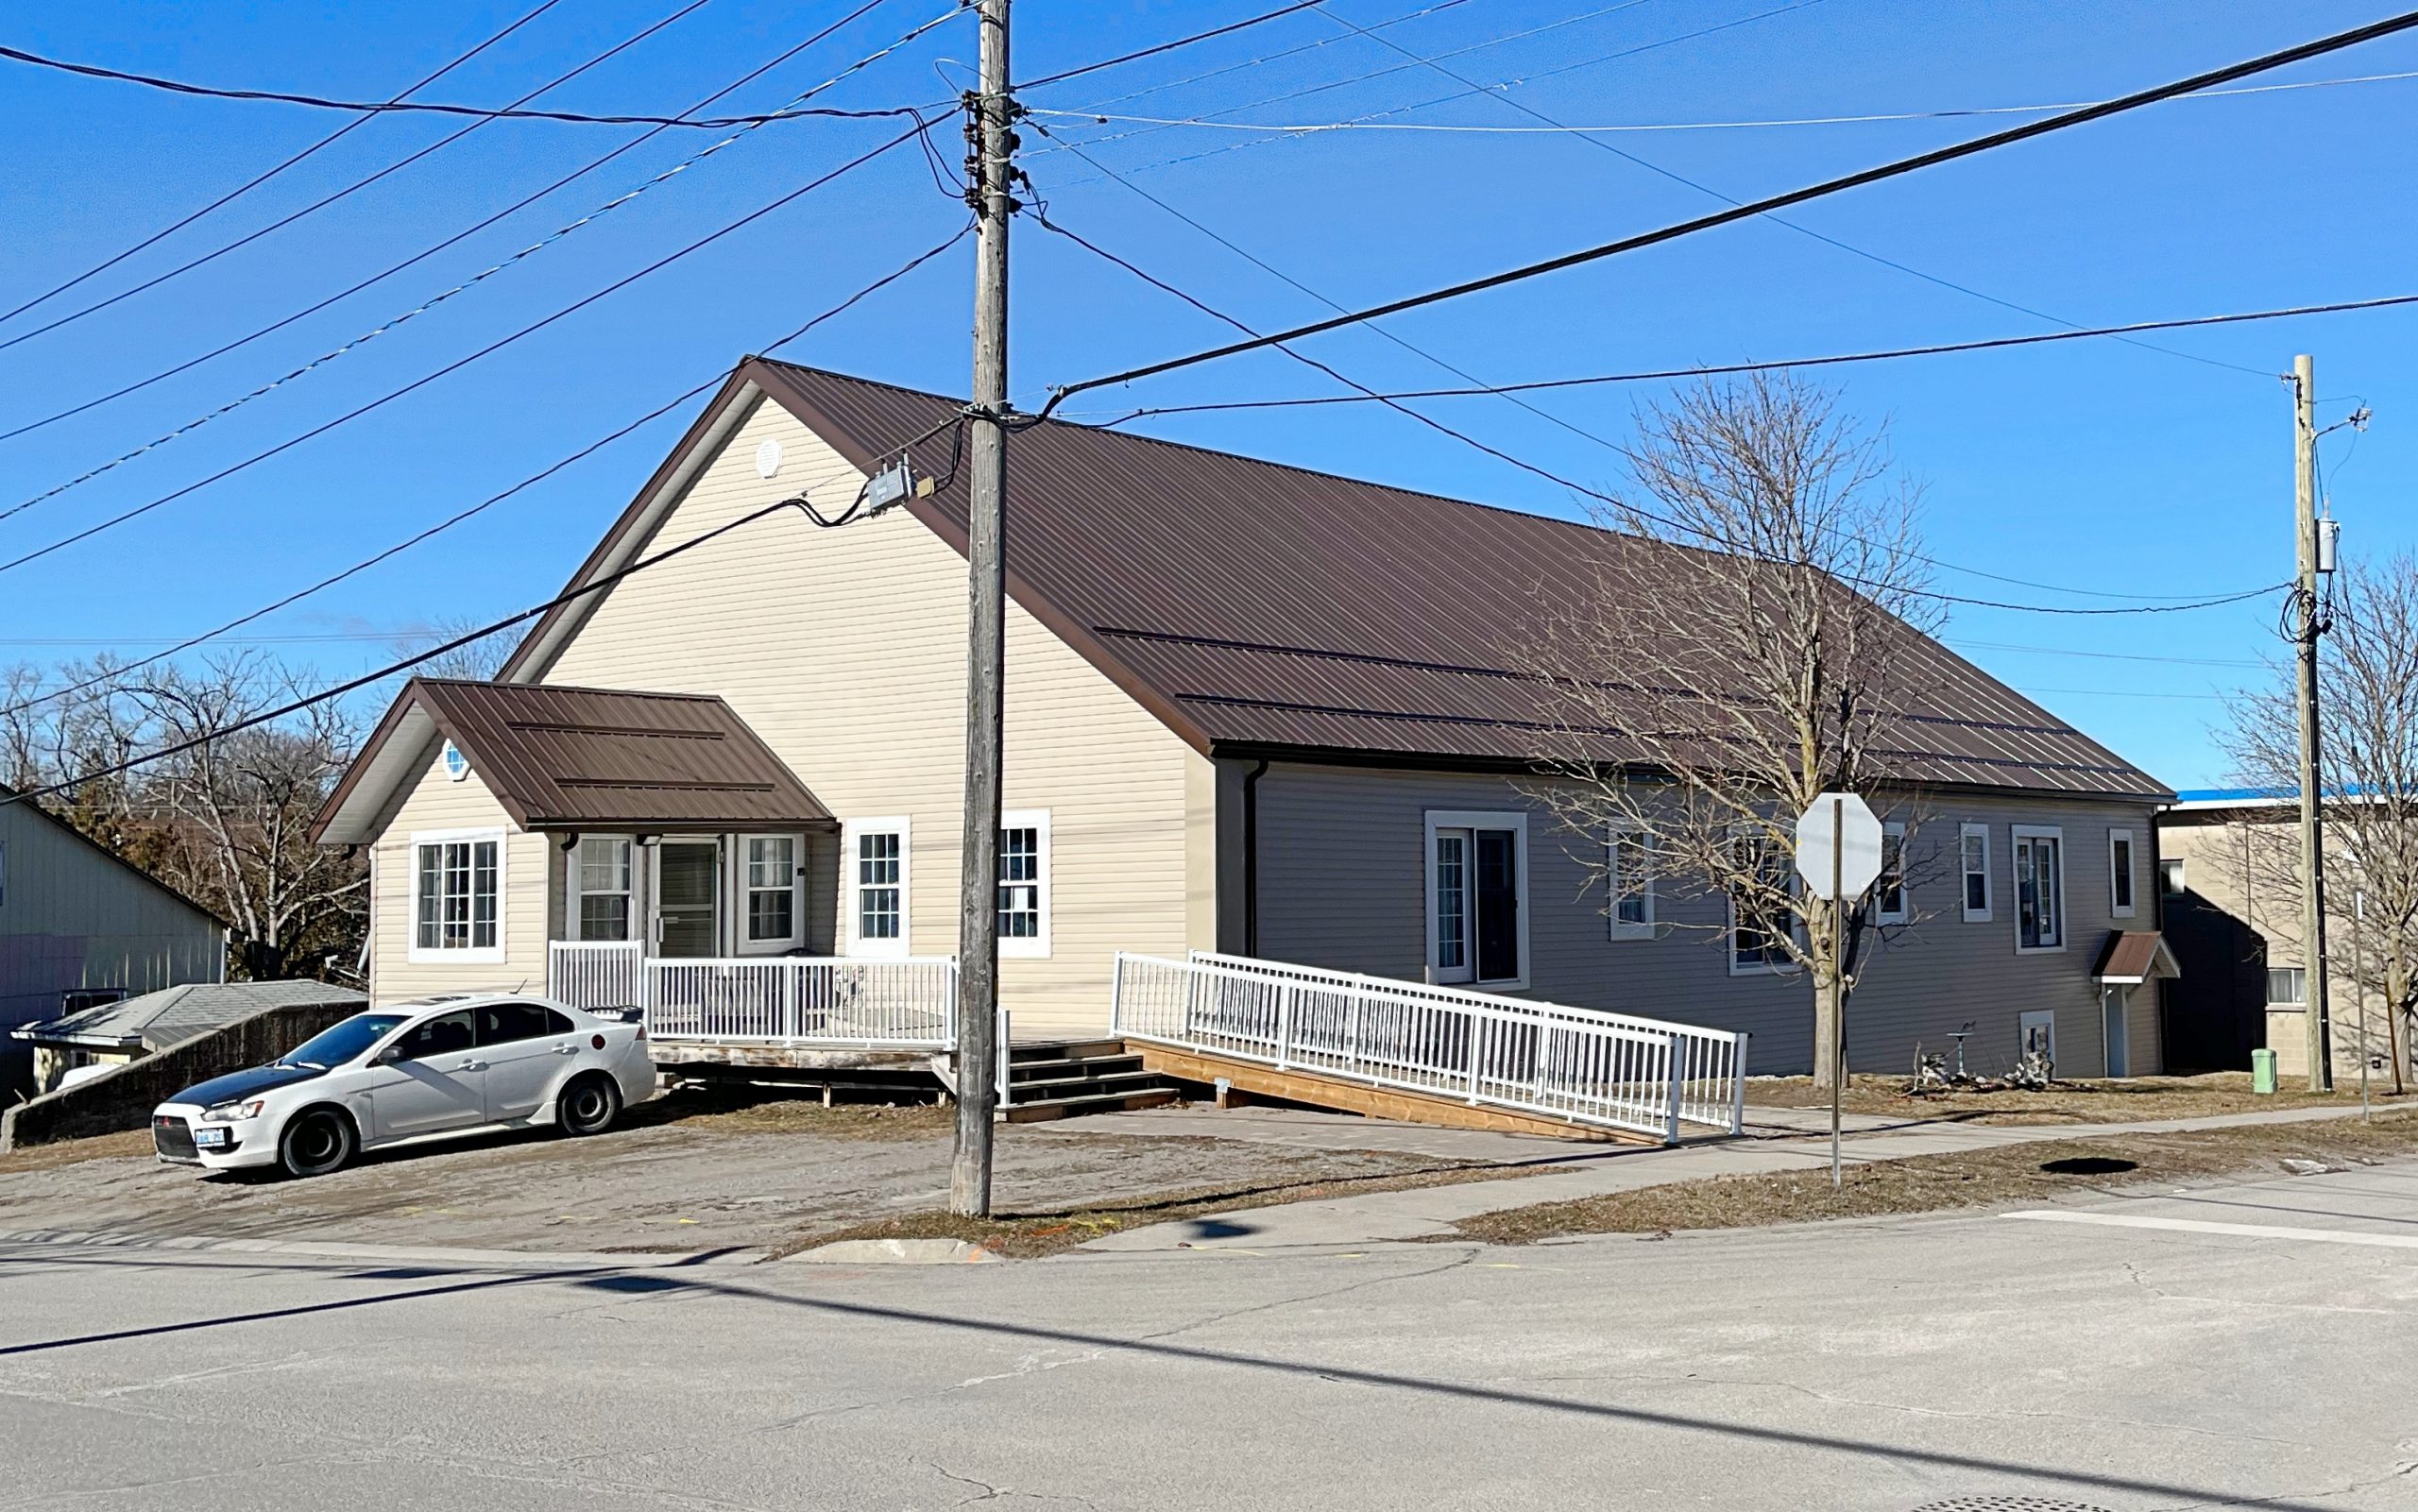
The photo below shows the property as it sits today after the cleanup was completed.  


Photos Courtesy of:

Google 

Uxbridge The Good Old Days by: J. Peter Hvidsten


Sources:

The Uxbridge Cosmos

Uxbridge The Good Old Days by: J. Peter Hvidsten

www.mykawartha.com

November 22, 2023

The Uxbridge Curling Club

The Uxbridge Curling Club

Seen above is the curling rink as it looks today.

 

In March 1960 Uxbridge curlers formed a committee to look into selecting a site and building a curling rink. 3 weeks later a site behind the old arena (now the site of the Seniors Centre) was selected. At the time the club had 129 curlers signed up for membership. In August the footings were poured and the new rink opened in November.

 

Below you can see the walls going up on the new rink and the finished building


Source & Photo credits 

Uxbridge The Good Old Days, by J. Peter Hvidsten

November 22, 2023

Main Street South Uxbridge

Main Street South Uxbridge


The above photo courtesy of Uxbridge The Good Old Days By: Peter Hvidsten shows what the east side of Main Street South looked like in 1957.  


Below we see the same veiw taken in 2022.   The commercial buildings and houses are still there but have all had some exterior changes during the past 65 years. 


Photo Credit: Uxbridge The Good Old Days By: Peter Hvidsten

November 21, 2023

Monday Market Minute November 20

Monday Market Minute November 13

Week of Sunday November 12 – Saturday November 18

Weekly Real Estate Market Minute for the Townships of Uxbridge and Scugog


Thank You For Watching
The Monday Market Minute November 13

See the October 2023 Housing Reports for

Check out our Uxbridge and Scugog Events Pages to keep up to date on whats going on around town.  Click the links or scan the Code with your phone to take you directly there.


UXBRIDGE EVENTS


SCUGOG EVENTS


Neighbour News
Monday Market MinuteMonday Market Minute November 13, 2023

Monday Market Minute November 13

Monday Market Minute November 13

Week of Monday November 5 – Saturday November 11

Weekly Real Estate Market Minute for the Townships of Uxbridge and Scugog


Thank You For Watching

The Monday Market Minute November 13

See the October 2023 Housing Reports for
Neighbour News
Uxbridge HistoryUxbridge HistoryUxbridge HistoryUxbridge HistoryUxbridge HistoryUxbridge HistoryUxbridge HistoryUxbridge HistoryUxbridge HistoryUxbridge HistoryUxbridge HistoryUxbridge HistoryUxbridge HistoryUxbridge HistoryUxbridge HistoryUxbridge HistoryUxbridge HistoryUxbridge HistoryUxbridge History November 8, 2023

The Market Hall

The Market HallThe Market Hall


The Market Hall was opened in October 1884 on the north east corner of Brock Street and Toronto Street. This building was erected two years after the original building was destroyed by fire. The lower floor was occupied by many different tenants over the years and Uxbridge council held its meetings on the upper level for many years. The building saw many sellers and buyers over its history but eventually the aging building began to deteriorate and was demolished in the mid 1950s and the buildings we see here today were erected.


The Market Hall

The above photos show what Brock Street from Toronto Street to Main Street looked like in the early 1890’s and in 2021.  In the upper photo  you can see the Market Building on the left. Other notable structures are the Fire Hall, The Bascom House and the Trinity United Church in the background.  Unfortunately the Bascom House is the only one still standing. 


The above photo taken in 1954 shows the Santa Claus parade moving along Brock Street in front of the Market Hall not long before it was demolished.


Photos Courtesy of 

Uxbridge The First 100 Years and Uxbridge The Good Old Days – by: Peter Hvidsten and the Uxbridge Historical Centre.

Monday Market Minute November 7, 2023

Monday Market Minute November 6

Real Estate Stats November 6, 2023

Kawartha Lakes Housing October 2023

Kawartha Lakes Housing October 2023

Kawartha Lakes

Housing Market Report for October 2023

Here is the Kawartha Lakes Housing October 2023 report (all housing types), with reports from the Canadian Real Estate AssociationToronto Regional Real Estate Board  included.

This housing report for Kawartha Lakes includes the number of new listings, average list price, number of properties sold, average selling price, average days on market and average asking price to selling price ratio for all property types within the Kawartha Lakes.


Scroll to the bottom for links to take you to the housing market reports for Durham, Uxbridge, Scugog and Brock.


CREA HOUSING MARKET REPORT – NOVEMBER 2023


From Toronto Regional Real Estate Board


Toronto Regional Real Estate Board – Market Stats At A Glance – October 2023


Read the Toronto Regional Real Estate Board  Market Watch Report


Kawartha Lakes


Kawartha Lakes Full Report

*Some values may vary slightly based on the exact date and time the reports were generated.


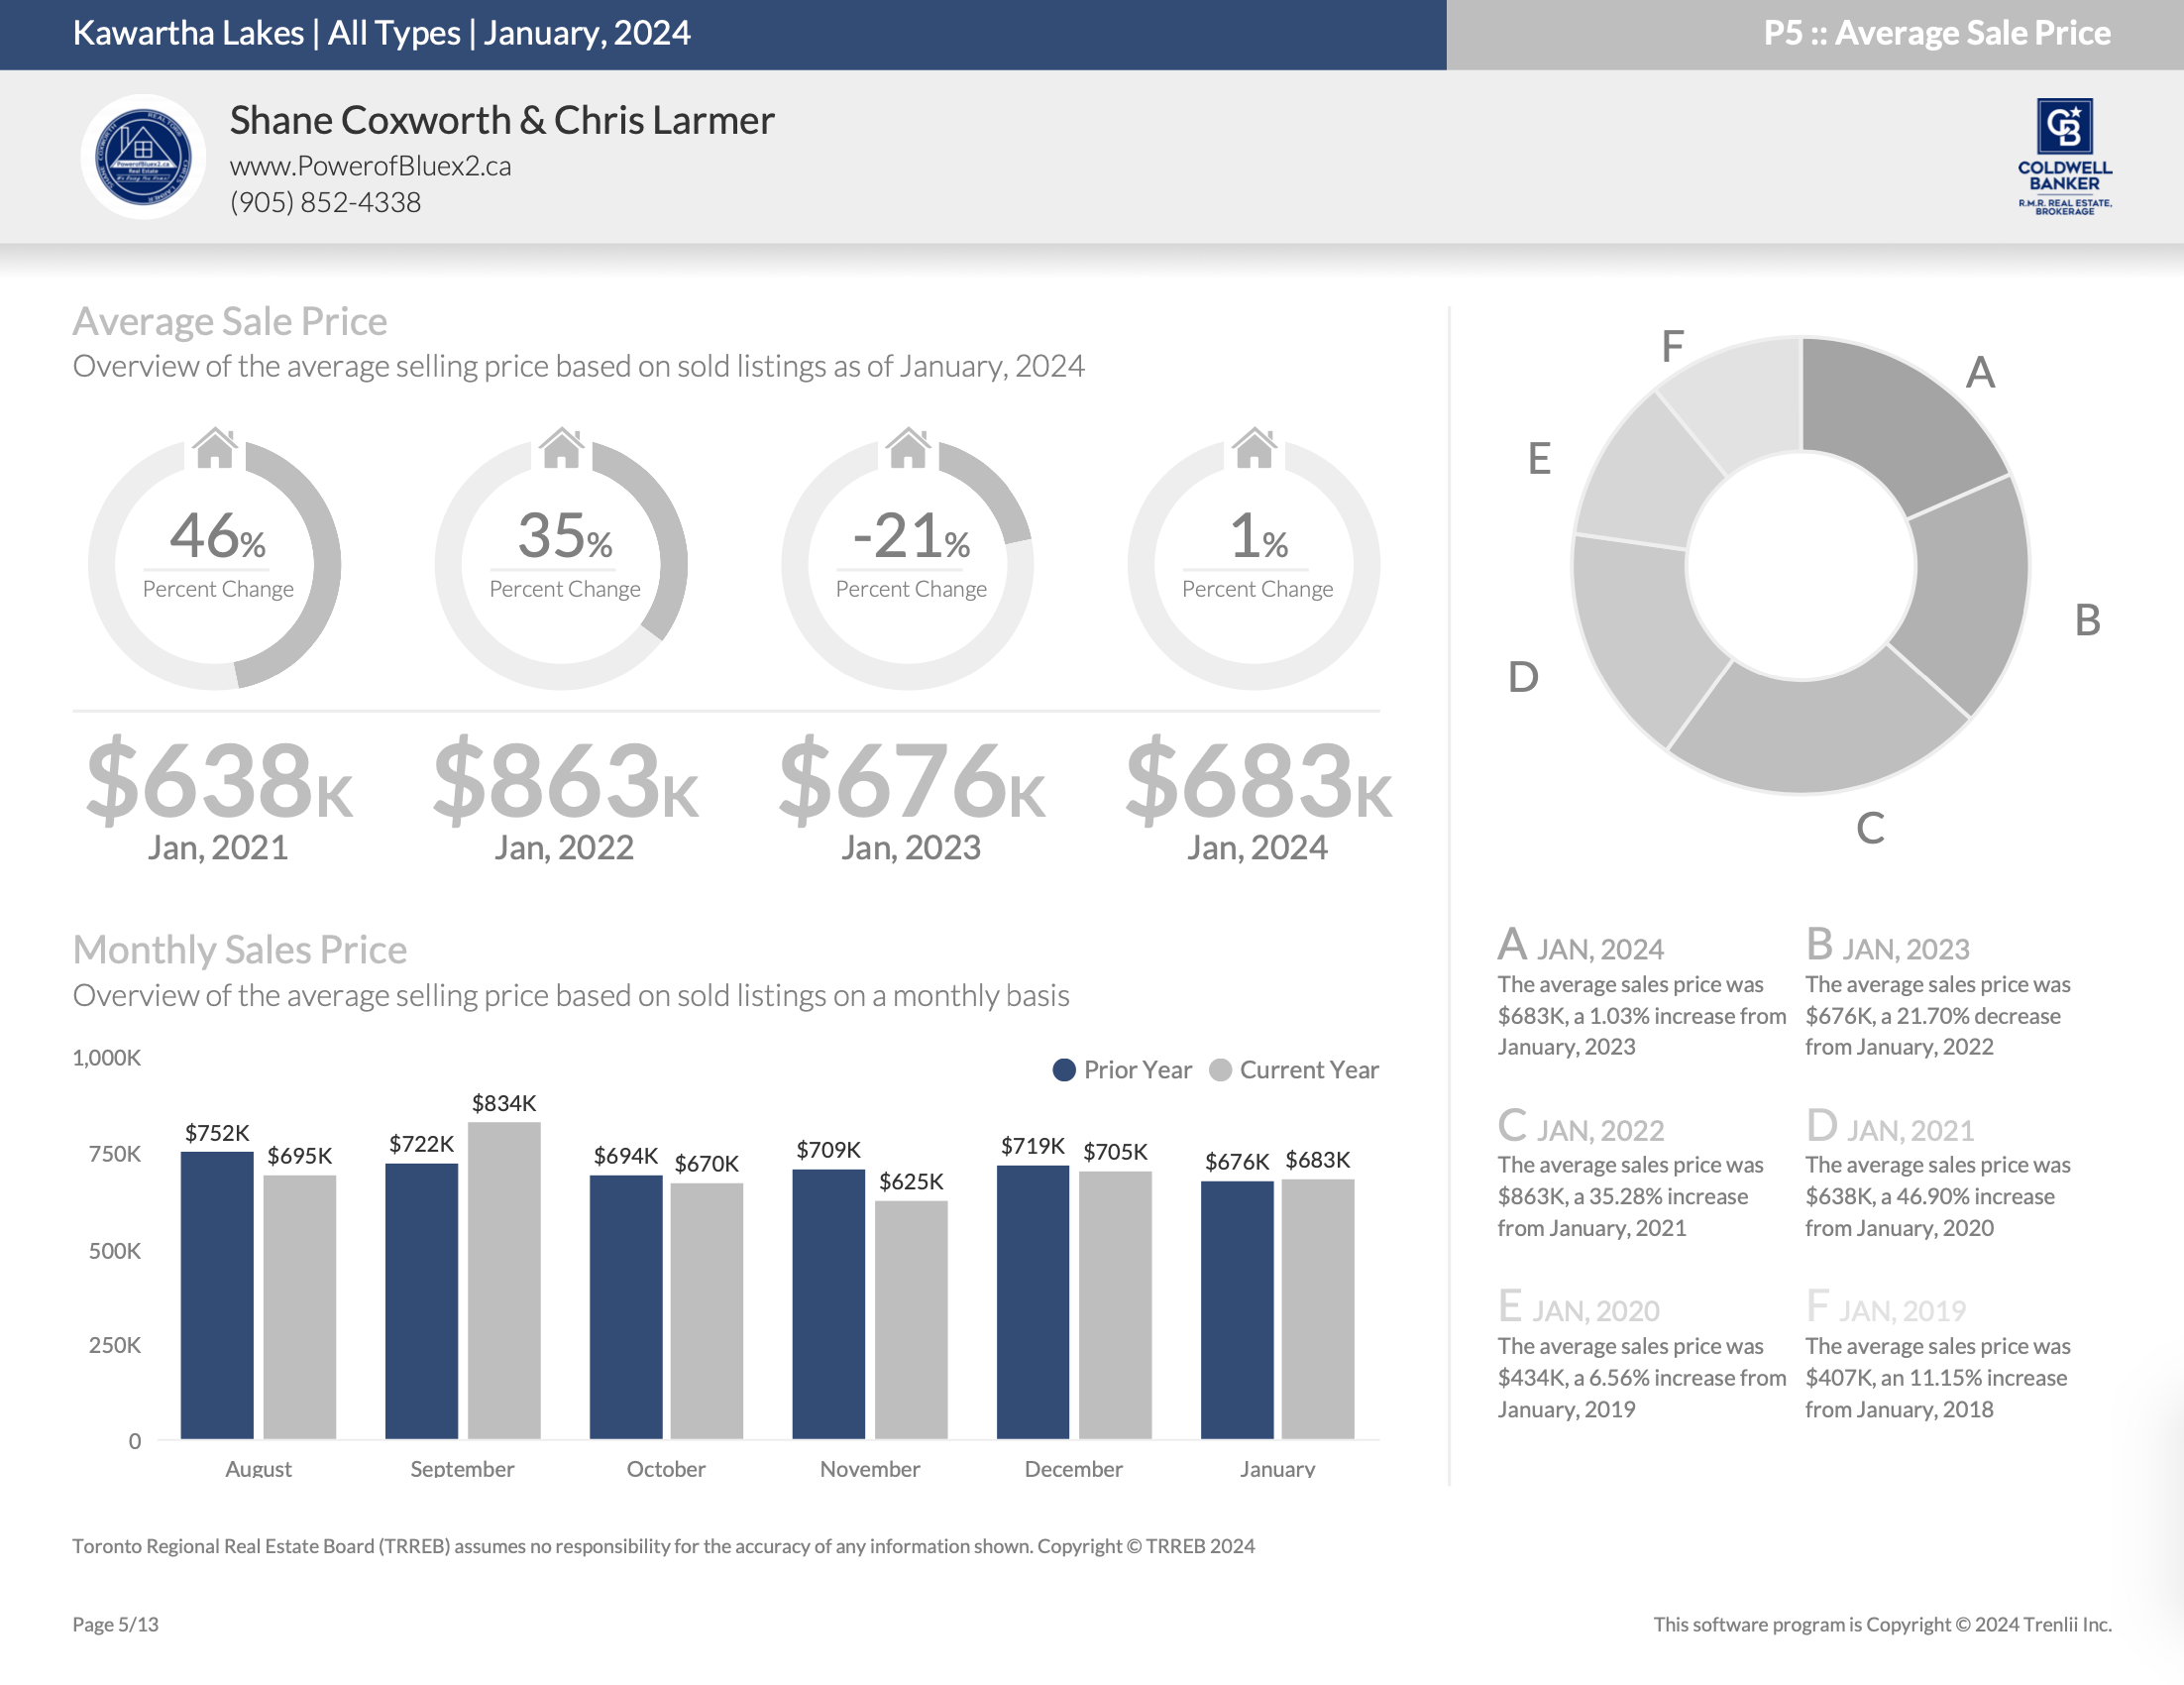
In October, 2023, we have seen 259 properties listed which has resulted in a 16.14% increase from October, 2022 in which 223 properties were listed; We have seen a year to date volume of 2939 in 2023 and 3265 in 2022 resulting in a 9.98% decrease. We have seen a total volume of 87 sold properties which has resulted in a 34.59% decrease from October, 2022 in which 133 listings were sold; We have seen a year to date volume of 1297 in 2023 and 1651 in 2022 resulting in a 21.44% decrease.

The average sales price in October, 2023 is $675K, a 2.66% decrease from October, 2022. The average sales price of October, 2022 was $694K. We have seen a year to date average sales price of $732K in 2023 and $791K in 2022 resulting in a 7.37% decrease.


Kawartha Lakes Housing October 2023


Quick Review

Kawartha Lakes Housing October 2023


New Listings – October 2023

Kawartha Lakes Housing October 2023


New Listings – Year-To-Date


Average Asking Price – October 2023

Kawartha Lakes Housing October 2023


Average Asking Price – Year-to-Date


Number of Properties Sold – October 2023

Kawartha Lakes Housing October 2023


Number of Properties Sold – Year-to-Date


Average Sold Price – October 2023

Kawartha Lakes Housing October 2023


Average Sold Price – Year-to-Date


Days on Market – October 2023

Kawartha Lakes Housing October 2023


Days on Market – Year-to-Date


Average List Price to Sell Price Ratio – October 2023

Kawartha Lakes Housing October 2023


Average List Price to Sell Price Ratio – Year-to-Date


*Information is believed to be accurate at time of posting but is not guaranteed to be correct 

Not intended as a solicitation if your property is already listed by another broker. Affiliated real estate agents are independent contractor sales associates, not employees. ©2021 Coldwell Banker. All Rights Reserved. Coldwell Banker and the Coldwell Banker logos are trademarks of Coldwell Banker Real Estate LLC. The Coldwell Banker® System is comprised of company owned offices which are owned by a subsidiary of Realogy Brokerage Group LLC and franchised offices which are independently owned and operated. The Coldwell Banker System fully supports the principles of the Fair Housing Act and the Equal Opportunity Act.


Click below for more reports

Durham Region

Township of Uxbridge

Township of Scugog

Township Brock


Neighbour News

Real Estate StatsReal Estate StatsReal Estate StatsReal Estate Stats November 6, 2023

Brock Housing October 2023

Brock Housing October 2023

Township of Brock


Housing Market Report for October 2023

Here is the Township of Brock  Housing October 2023 report (all housing types), with reports from the Canadian Real Estate AssociationToronto Regional Real Estate Board and the Durham Association of REALTORS®  included.

This housing report for Township of Brock includes the number of new listings, average list price, number of properties sold, average selling price, average days on market and average asking price to selling price ratio for all property types within the Township of Brock.


Scroll to the bottom for links to take you to the housing market reports for Durham, Uxbridge, Scugog and the Kawartha Lakes.


CREA HOUSING MARKET REPORT – OCTOBER 2023


From Toronto Regional Real Estate Board


Toronto Regional Real Estate Board – Market Stats At A Glance – October 2023


Read the Toronto Regional Real Estate Board  Market Watch Report


Durham REALTORS® Report October 2023 Housing Statistics


Read the Durham Association of REALTORS® FULL Real Estate Report


Township of Brock

Township of Brock Full Report

*Some values may vary slightly based on the exact date and time the reports were generated.


In October, 2023, we have seen 47 properties listed which has resulted in a 4.44% increase from October, 2022 in which 45 properties were listed; We have seen a year to date volume of 451 in 2023 and 504 in 2022 resulting in a 10.52% decrease. There were 14 sold properties which has resulted in a 30.00% decrease from October, 2022 in which 20 listings were sold; We have seen a year to date volume of 187 in 2023 and 212 in 2022 resulting in an 11.79% decrease.

The average sales price in October, 2023 is $746K, a 2.14% decrease from October, 2022. The average sales price of October, 2022 was $762K. We have seen a year to date average sales price of $800K in 2023 and $942K in 2022 resulting in a 15.10% decrease.


Brock Housing October 2023


Quick Review

Brock Housing October 2023


New Listings – October 2023

Brock Housing October 2023


New Listings – Year-To-Date


Average Asking Price – October 2023

Brock Housing October 2023


Average Asking Price – Year-to-Date


Number of Properties Sold – October 2023

Brock Housing October 2023


Number of Properties Sold – Year-to-Date


Average Sold Price – October 2023

Brock Housing October 2023


Average Sold Price – Year-to-Date


Days on Market – October 2023

Brock Housing October 2023


Days on Market – Year-to-Date


Average List Price to Sell Price Ratio – October 2023

Brock Housing October 2023


Average List Price to Sell Price Ratio – Year-to-Date


*Information is believed to be accurate at time of posting but is not guaranteed to be correct 

Not intended as a solicitation if your property is already listed by another broker. Affiliated real estate agents are independent contractor sales associates, not employees. ©2021 Coldwell Banker. All Rights Reserved. Coldwell Banker and the Coldwell Banker logos are trademarks of Coldwell Banker Real Estate LLC. The Coldwell Banker® System is comprised of company owned offices which are owned by a subsidiary of Realogy Brokerage Group LLC and franchised offices which are independently owned and operated. The Coldwell Banker System fully supports the principles of the Fair Housing Act and the Equal Opportunity Act.


Click below for more reports

Durham Region

Township of Uxbridge

Township of Scugog

City of Kawartha Lakes


Neighbour News

November 6, 2023

Scugog Housing October 2023

Scugog Housing October 2023

Township of Scugog

Housing Market Report for October 2023

Here is the Township of Scugog  Housing October 2023 report (all housing types), with reports from the Toronto Regional Real Estate Board and the Central Lakes Association of REALTORS®  included.

This housing report for Township of Scugog includes the number of new listings, average list price, number of properties sold, average selling price, average days on market and average asking price to selling price ratio for all property types within the Township of Scugog.


Scroll to the bottom for links to take you to the housing market reports for Durham, Uxbridge, Brock and the Kawartha Lakes


CREA HOUSING MARKET REPORT – NOVEMBER 2023


TRREB Housing Market Charts October 2023


Read the Toronto Regional Real Estate Board  Market Watch Report


Read the Durham Association of REALTORS® FULL Real Estate Report


Township of Scugog

Township of Scugog Full Report


*Some values may vary slightly based on the exact date and time the reports were generated.


In October, 2023, we have seen 54 properties listed which has resulted in a 17.39% increase from October, 2022 in which 46 properties were listed; We have seen a year to date volume of 563 in 2023 and 490 in 2022 resulting in a 14.90% increase. There were 19 sold properties which has resulted in an 11.76% increase from October, 2022 in which 17 listings were sold; We have seen a year to date volume of 279 in 2023 and 266 in 2022 resulting in a 4.89% increase.

The average sales price in October, 2023 is $1.04 million, a 10.49% increase from October, 2022. The average sales price of October, 2022 was $938 thousand. We have seen a year to date average sales price of $998 thousand in 2023 and $1.15 million in 2022 resulting in a 12.92% decrease.

Scugog Housing October 2023


Quick Review

Scugog Housing October 2023


New Listings – October 2023

Scugog Housing October 2023


New Listings – Year-To-Date


Average Asking Price – October 2023

Scugog Housing October 2023


Average Asking Price – Year-to-Date


Number of Properties Sold – October 2023

Scugog Housing October 2023


Number of Properties Sold – Year-to-Date


Average Sold Price – October 2023

Scugog Housing October 2023


Average Sold Price – Year-to-Date


Days on Market – October 2023

Scugog Housing October 2023


Days on Market – Year-to-Date


Average List Price to Sell Price Ratio – October 2023

Scugog Housing October 2023


Average List Price to Sell Price Ratio – Year-to-Date


*Information is believed to be accurate at time of posting but is not guaranteed to be correct 

Not intended as a solicitation if your property is already listed by another broker. Affiliated real estate agents are independent contractor sales associates, not employees. ©2021 Coldwell Banker. All Rights Reserved. Coldwell Banker and the Coldwell Banker logos are trademarks of Coldwell Banker Real Estate LLC. The Coldwell Banker® System is comprised of company owned offices which are owned by a subsidiary of Realogy Brokerage Group LLC and franchised offices which are independently owned and operated. The Coldwell Banker System fully supports the principles of the Fair Housing Act and the Equal Opportunity Act.


Click below for more reports

Durham Region

Township of Uxbridge

Township Brock

City of Kawartha Lakes


Neighbour News

November 6, 2023

Uxbridge Housing October 2023

Uxbridge Housing October 2023


Housing Market Report for October 2023

Here is the Township of Uxbridge  Housing October 2023 report (all housing types), with reports from the Toronto Regional Real Estate Board and the Central Lakes Association of REALTORS®  included.

This housing report for Township of Uxbridge includes the number of new listings, average list price, number of properties sold, average selling price, average days on market and average asking price to selling price ratio for all property types within the Township of Uxbridge.


Scroll to the bottom for links to take you to the housing market reports for Durham, Scugog, Brock and the Kawartha Lakes.


CREA HOUSING MARKET REPORT – NOVEMBER 2023


From Toronto Regional Real Estate Board


Toronto Regional Real Estate Board – Market Stats At A Glance – October 2023


Read the Toronto Regional Real Estate Board  Market Watch Report 


Durham REALTORS® Report October 2023 Housing Statistics


Read the Durham Association of REALTORS® FULL Real Estate Report


Township of Uxbridge Full Report


*Some values may vary slightly based on the exact date and time the reports were generated.


In October, 2023, we have seen 55 properties listed which has resulted in a 14.06% decrease from October, 2022 in which 64 properties were listed; We have seen a year to date volume of 519 in 2023 and 502 in 2022 resulting in a 3.39% increase. There were 19 sold properties which has not increased or decreased from October, 2022 in which 19 listings were sold; We have seen a year to date volume of 245 in 2023 and 261 in 2022 resulting in a 6.13% decrease.

The average sales price in October, 2023 is $1.39 million, a 25.76% increase from October, 2022. The average sales price of October, 2022 was $1.11 million. We have seen a year to date average sales price of $1.32 million in 2023 and $1.35 million in 2022 resulting in a 2.50% decrease.


Uxbridge Housing October 2023


Quick Review

Uxbridge Housing October 2023


New Listings – October 2023

Uxbridge Housing October 2023


New Listings – Year-To-Date


Average Asking Price – October 2023

Uxbridge Housing October 2023


Average Asking Price – Year-to-Date


Number of Properties Sold – October 2023

Uxbridge Housing October 2023


Number of Properties Sold – Year-to-Date


Average Sold Price – October 2023

Uxbridge Housing October 2023


Average Sold Price – Year-to-Date


Days on Market – October 2023

Uxbridge Housing October 2023


Days on Market – Year-to-Date


Average List Price to Sell Price Ratio – October 2023

Uxbridge Housing October 2023


Average List Price to Sell Price Ratio – Year-to-Date


*Information is believed to be accurate at time of posting but is not guaranteed to be correct 

Not intended as a solicitation if your property is already listed by another broker. Affiliated real estate agents are independent contractor sales associates, not employees. ©2021 Coldwell Banker. All Rights Reserved. Coldwell Banker and the Coldwell Banker logos are trademarks of Coldwell Banker Real Estate LLC. The Coldwell Banker® System is comprised of company owned offices which are owned by a subsidiary of Realogy Brokerage Group LLC and franchised offices which are independently owned and operated. The Coldwell Banker System fully supports the principles of the Fair Housing Act and the Equal Opportunity Act.


Click below for more reports

Durham Region

Township of Scugog

Township Brock

City of Kawartha Lakes


Neighbour News

November 6, 2023

Durham Region Housing October 2023

Durham Region Housing October 2023

Durham

Housing Market Report for October 2023

Here is the Region of Durham  Housing October 2023 report (all housing types), with reports from the Canadian Real Estate AssociationToronto Regional Real Estate Board and the Durham Association of REALTORS®  included.

This housing report for Durham Region includes the number of new listings, average list price, number of properties sold, average selling price, average days on market and average asking price to selling price ratio for all property types within the Region of Durham.


Scroll to the bottom for links to take you to the housing market reports for Uxbridge, Scugog, Brock and the Kawartha Lakes.


CREA HOUSING MARKET REPORT – NOVEMBER 2023


From Toronto Regional Real Estate Board

From Toronto Regional Real Estate Board


Toronto Regional Real Estate Board – Market Stats At A Glance – October 2023


Read the Toronto Regional Real Estate Board  Market Watch Report 


Durham REALTORS® Report October 2023 Housing Statistics


Read the Durham Association of REALTORS® FULL Real Estate Report


Durham


Durham Region Full Report

*Some values may vary slightly based on the exact date and time the reports were generated.


The real estate market in Durham Region has shown interesting trends throughout 2023. The average sale price, which started the year at $886,849 in January, experienced a modest increase in the spring before levelling off and reaching $931,548 in October. Active listings have steadily risen since January, providing more options for potential buyers. In terms of days on market, we observed a dip during the spring, which is a typical pattern, followed by a gradual increase, averaging 26 days on the market in October. January saw 394 sales, with the number of sales peaking in May and subsequently declining to 588 in October. However, despite the drop in sales volume, the sales price has remained relatively stable. In October, there were 3.01 months of inventory, indicating that the market is in a balanced state. While the number of sales has decreased, there hasn’t been a dramatic impact on property prices, making Durham Region an attractive and resilient market for both buyers and sellers.


Durham Region Housing October 2023


Quick Review

Durham Region Housing October 2023


New Listings – October 2023

Durham Region Housing October 2023


New Listings – Year-To-Date


Average Asking Price – October 2023

Durham Region Housing October 2023


Average Asking Price – Year-to-Date


Number of Properties Sold – October 2023

Durham Region Housing October 2023


Number of Properties Sold – Year-to-Date


Average Sold Price – October 2023

Durham Region Housing October 2023


Average Sold Price – Year-to-Date


Days on Market – October 2023

Durham Region Housing October 2023


Days on Market – Year-to-Date


Average List Price to Sell Price Ratio – October 2023

Durham Region Housing October 2023


Average List Price to Sell Price Ratio – Year-to-Date


*Information is believed to be accurate at time of posting but is not guaranteed to be correct 

Not intended as a solicitation if your property is already listed by another broker. Affiliated real estate agents are independent contractor sales associates, not employees. ©2021 Coldwell Banker. All Rights Reserved. Coldwell Banker and the Coldwell Banker logos are trademarks of Coldwell Banker Real Estate LLC. The Coldwell Banker® System is comprised of company owned offices which are owned by a subsidiary of Realogy Brokerage Group LLC and franchised offices which are independently owned and operated. The Coldwell Banker System fully supports the principles of the Fair Housing Act and the Equal Opportunity Act.


Click below for more reports

Township of Uxbridge

Township of Scugog

Township Brock

City of Kawartha Lakes


Neighbour News

Monday Market Minute October 30, 2023

Monday Market Minute October 30

Monday Market Minute October 30

Week of Monday October 22 – Saturday October 28

Weekly Real Estate Market Minute for the Townships of Uxbridge and Scugog


Thank You For Watching

The Monday Market Minute October 30

See the September 2023 Housing Reports for
Neighbour News
October 25, 2023

Uxbridge Coat of Arms

Uxbridge Coat of Arms

Uxbridge Coat of Arms


In 1956, Uxbridge became the second town in Canada and the first in Ontario to receive an official coat-of-arms.

Alan Beddoe of Ottawa, the Heraldy Advisor to the Royal Canadian Navy along with local officials and the College of Arms in London, England created the design which was taken to England for approval.  The Coat of Arms was presented during a ceremony, “A Salute to Uxbridge” and was broadcast live on CBC.  The Honourable Louis O. Breithaupt, the 18th Lieutenant Governor of Ontario was on hand to present the Coat of Arms to Uxbridge Mayor, Carl Puterbough.

At the ceremony the description of the Coat of Arms was read out by Alan Beddoe.   

“Starting at the bottom, on the shield are two blue wavey lines on white to indicate water, over it is the bridge in green which refers to the green timbers that were used to make it. On the bridge is a gold Maple Leaf from the Arms of Ontario, implying that the Uxbridge being referred to is in Province of Ontario. Over the bridge is the mask of an Ox. Thus, here is the name of the Town, Ox- (or Ux) bridge. The shield’s background is gold (for Gould, the founder of the town) and on either flank are rye sheaves on green background to depict it is in the heart of an agriculture community. The sheaves also refer to the straw that covers the back of the oxen. The mantle flowing out of the helmet is green on the outer side with a white lining as the Livery colours of Uxbridge are white and green. Out of the crown, which is made to look like gold masonry, is a red lion. The lion is derived from the Crest in the Arms of Uxbridge, Middlesex, England, and refers to the British traditions we have inherited in this country. It also links us up with that sister town across the ocean. In the Lion’s paws is a cogwheel, which refers to manufacturing and the industry of the people of Uxbridge. This last meaning is also brought out in the Motto (at the bottom) ON’T UXBRIDGE, or “On To It Uxbridge!” – Alan Beddoe.


In the photos below you can see the Coat of Arms displayed on the front of the Music Hall and on the entrance signs to town.


Uxbridge Coat of Arms


Uxbridge Coat of Arms


Source: Uxbridge the Good Old Days by: Peter Hvidsten